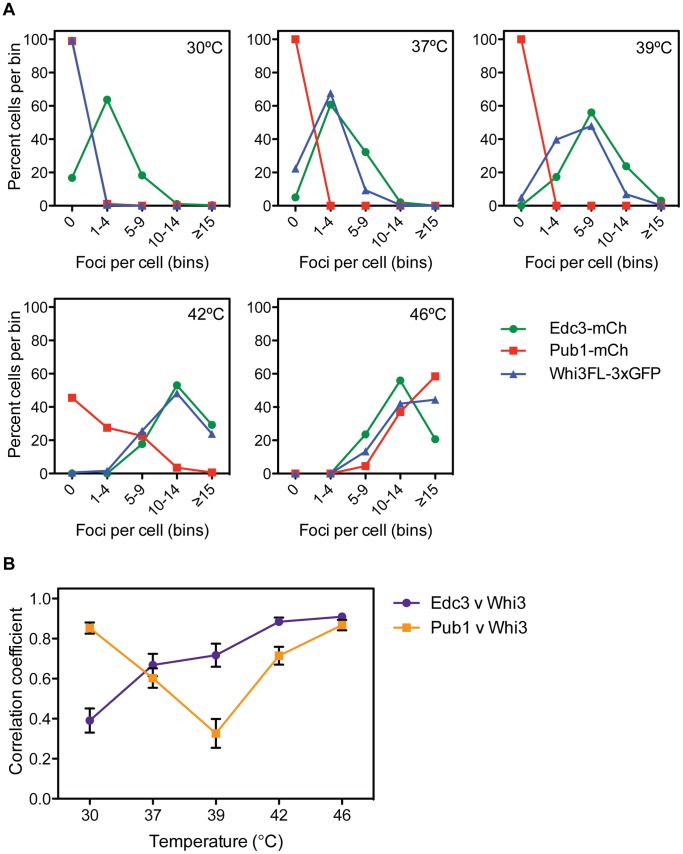
Figure 4. Quantification of temperature course data.
(A) Double-blinded quantification of data from experiments presented in Figure 3. Whi3-3xGFP, Pub1-mCh, and Edc3-mCh foci were manually counted using a binning method, as automated analysis was not possible. Edc3-mCh forms foci at all temperatures, though foci become enriched as temperatures increase. Pub1-mCh remains diffusely cytosolic until 42°C, at which point it localizes to foci. Whi3FL-3xGFP forms increasing numbers of foci starting at 37°C. An average of 300 cells were analyzed for each protein at each temperature. (B) Double-blinded colocalization analysis of experiments presented in Figure 3. Using ImageJ software [49], a line was drawn through a cell, avoiding the vacuole, and a plot of signal intensity was generated. The analysis was repeated in the corresponding image and a Pearson’s correlation coefficient between the two lines was calculated. Data presented are the average of 20 cells; error bars represent SEM. Pub1-mCh and Whi3FL-3xGFP exhibit high correlation at 30°C when both are diffusely cytosolic, but correlation decreases at 37°C and 39°C when Whi3 begins localizing to foci. Pub1 and Whi3 correlate more robustly once Pub1 foci begin to form at 42°C. Edc3-mCh and Whi3FL-3xGFP correlate poorly at 30°C when Edc3 is in foci, but become more highly correlated as temperatures increase.

