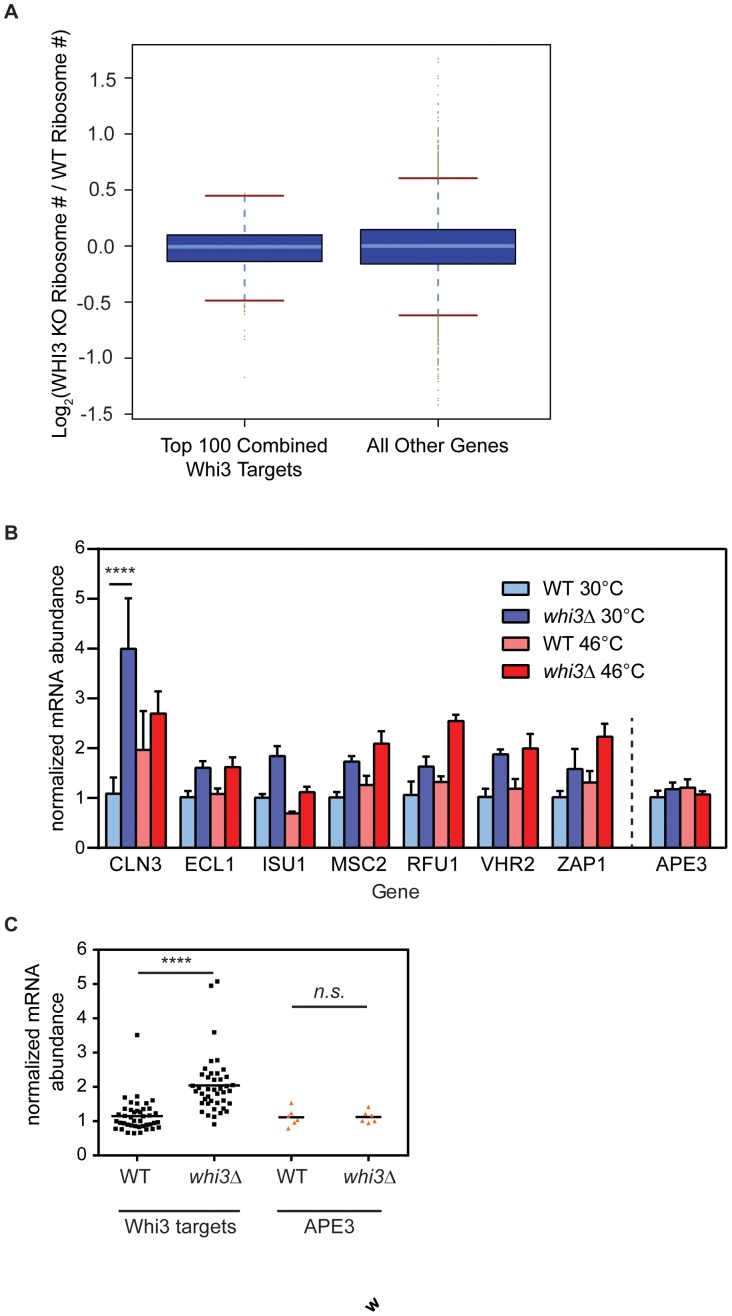
Figure 6. Whi3 changes steady-state levels of its target mRNAs without affecting translation rates.
(A) Boxplot of log base 2 of the fold change in the average number of ribosomes bound to each mRNA in a Whi3 deletion versus a wild-type strain. The top 100 high-confidence Whi3 targets are plotted on the left, compared to all other mRNAs on the right, showing that there is no significant difference in the change in ribosome number in response to Whi3 deletion between these two sets of mRNAs. (B) Wild-type or whi3Δ cells were grown to mid-log phase in YPD, then incubated for 15 minutes at 30°C or 46°C. RT-PCR analysis examined levels of several RNA targets identified in Figure 5. Data are averages of three biological replicates; error bars represent SEM. ****, p<0.0001, Sidak’s post test correction for multiple comparison. (C) Pooled data from B. Normalized mRNA abundance is plotted for Whi3 targets or APE3, grouped by strain background, wild-type or whi3Δ. ****, p<0.0001, 2-way ANOVA.

