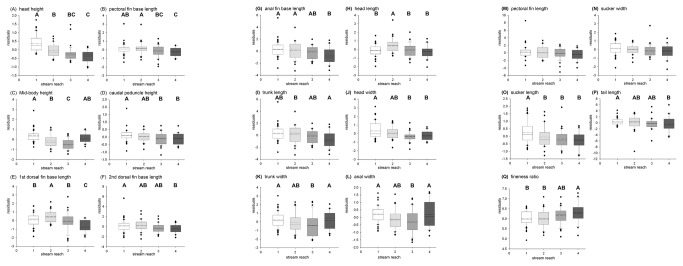
Figure 4. Variation in morphometric variables across successively higher elevation collecting localities.

Size-corrected residuals of sixteen morphological traits (and the hydrodynamic index fineness ratio) compared among the four collection sites (Nanue 1 through 4 on the x-axis). Solid lines represent medians, dashed lines represent means, boxes indicate the 25th and 75th percentiles, and bars delineate 10th and 90th percentiles. Data points outside this range are graphed individually. Alphabetical designations for the ANOVA groupings of sites follow the rank of mean values, with earlier letters indicating higher means. Sample sizes for all graphs: Nanue 1, N=50; Nanue 2, N=30; Nanue 3, N=35; Nanue 4, N=21.
