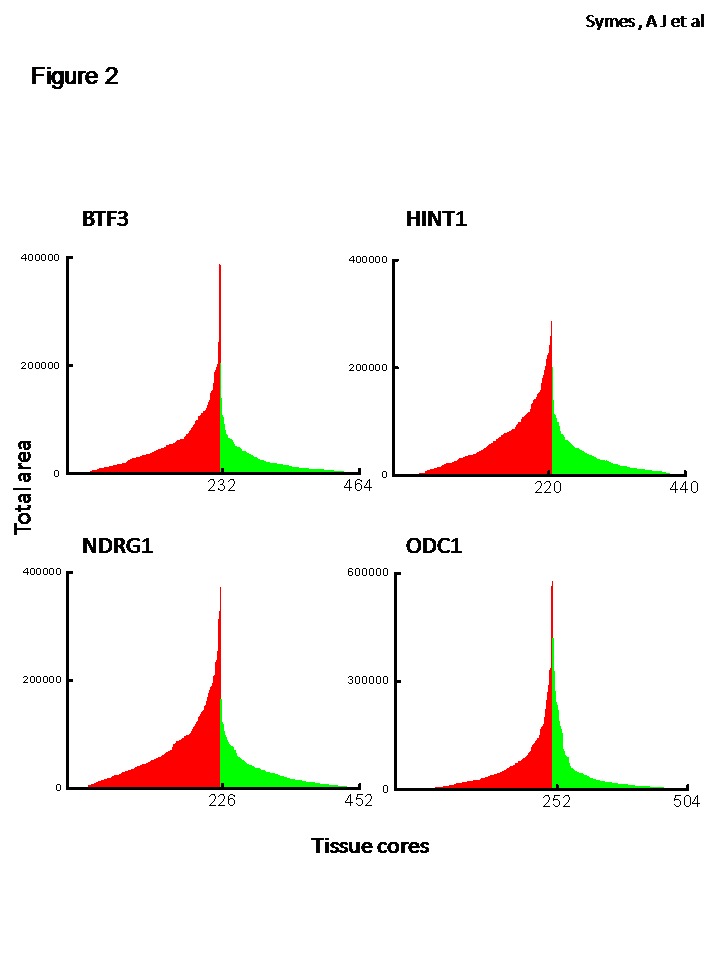
Figure 2. Quantitation of DAB signal in prostate tissue array.

An unbiased, automated protocol was used to calculate Total Area stained (in pixel) standardized to amount of tissue in each core (see Methods). TA is converted to Area Fraction (total area divided by the total pixels in the image). Each bin is data for an individual, malignant (red) or non-malignant tissue (green) core. There is a significant increase in the AUC of protein expression in malignant v non-malignant prostate tissue (p<0.0001).
