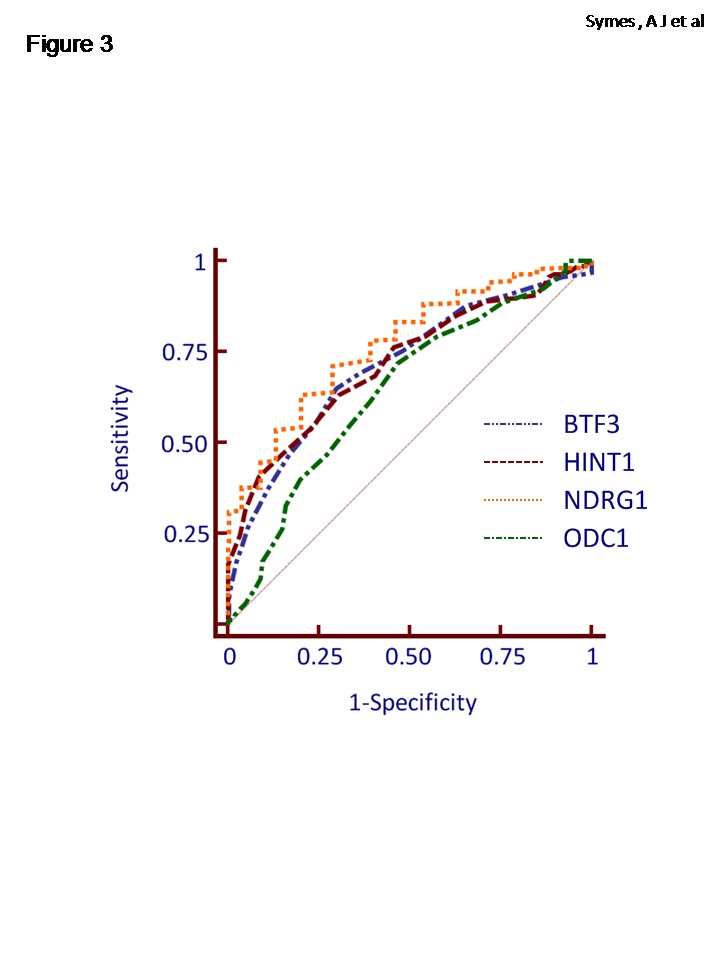
Figure 3. ROC of putative prostate cancer biomarkers.

ROC curve demonstrates the discriminating performance of the protein expression in the differentiation between malignant and non-malignant tissue cores using the area fraction (probit) data for BTF3, HINT1, NDRG1 and ODC1. The operating characteristic values are given in Table S1. The solid line represents the ROC area of 0.5.
