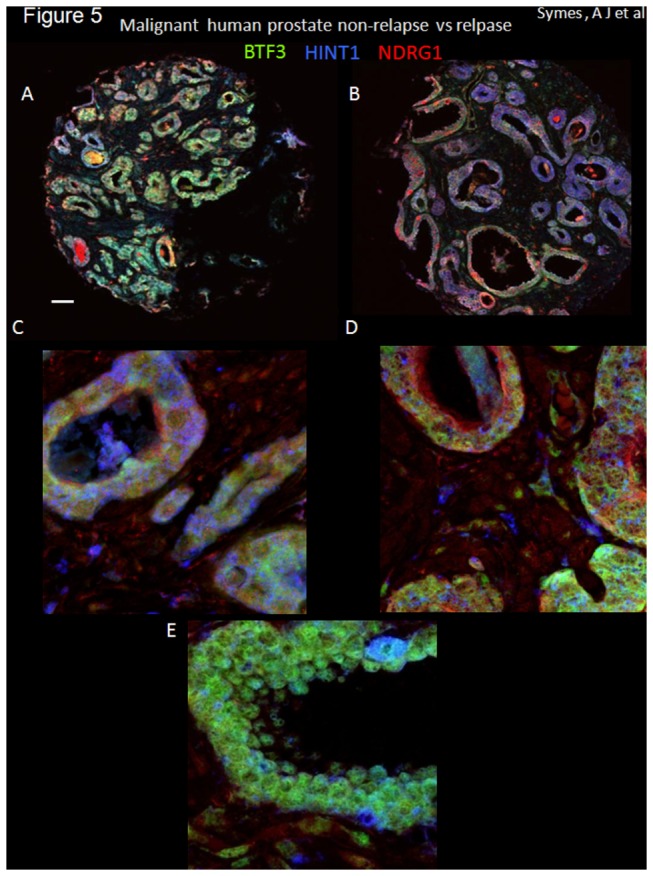
Figure 5. Differential pattern for BTF3, HINT1 and NDRG1 co-expression in malignant, biochemical relapse and non-relapse sample.

Co-expression of three proteins BTF3 (FITC-green), HINT1 (Cy3- blue) and NDRG1 (Cy5 –red) in malignant prostate tissue cores (A to D). Composite micrographs of immunofluorescently stained prostate tissue cores from patients with biochemical relapse (defined as PSA ≥ 0.2 ng/ml within 2 years of radical prostatectomy). Tissue cores from 4 patients (matched pairs for Gleason score and PSA), non-relapsed (A) and biochemical relapse (B) representative images used for quantitative co-localization analysis (see methods) are shown. Imaging was performed using a Leica confocal microscope; A and B are low magnification; C and D higher magnification; E is an example of the expression of the three markers in non-malignant tissue also at higher magnification. The expression of BTF3 (green), for example is evident in non-relapsed samples whereas it not very evident in cores from relapsed patients. Imaging was performed using an Olympus confocal microscope (40x tiled (A and B) or 40x with digital zoom 3.5-4 (C, D and E). High magnification images (C,D and E) were deconvolved using Huygens Profession software. 16bit tif files for each fluorophore (FITC, Cy3 and Cy5) were imported into ImageJ and pseudo colored (FITC, green, Cy3, blue and Cy5, red). Z-projections for up to 27 images are shown for each tissue core. Scale bar =100µm for A and B and 20µm for C and D. Quantitative colocalization analysis of images (e.g. Figure 5C and D) showed that most significant change in the pattern of expression, in non-relapsed vs relapsed samples, was due to the change in co-expression of BTF3 (FITC, green) and HINT1 (Cy3, blue) with Pearson coefficients for colocalization for non-relapse vs relapse = 0.73 ± 0.02 vs 0.60 ± 0.07 (means ± SD, n=4 , significance of difference p<0.02).
