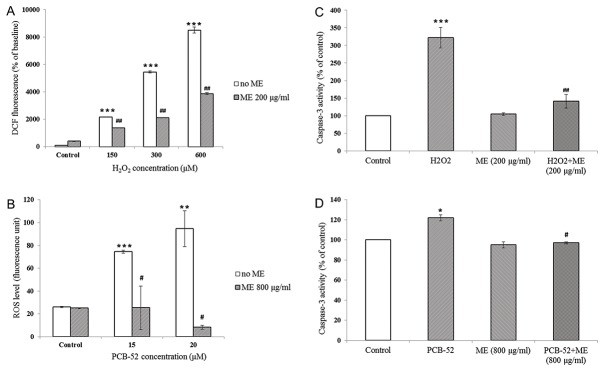
Figure 3. Effects of ME on oxidative stress and apoptosis in vitro.

(A, B) Intracellular levels of ROS in SK-N-SH cells treated with H2O2 (A) or PCB-52 (B) for 24 h with or without prior ME incubation. ROS levels were determined using DCFH-DA assay. The fluorescence was measured and expressed as percentage compared to untreated cells (n=3 independent experiments for each bar). (C, D) Caspase-3 activity in SK-N-SH cells treated with H2O2 (C) or PCB-52 (D) with or without ME preincubation. Caspase-3 activity was measured using colorimetric assay. Data were expressed as percentage of the activity compared to untreated cells (n=5 independent experiments for each bar). *P < 0.05, ** P < 0.01, *** P < 0.001 compared to untreated control; # P < 0.05, ## P < 0.01 compared to cells treated with corresponding chemicals concentration with no ME preincubation.
