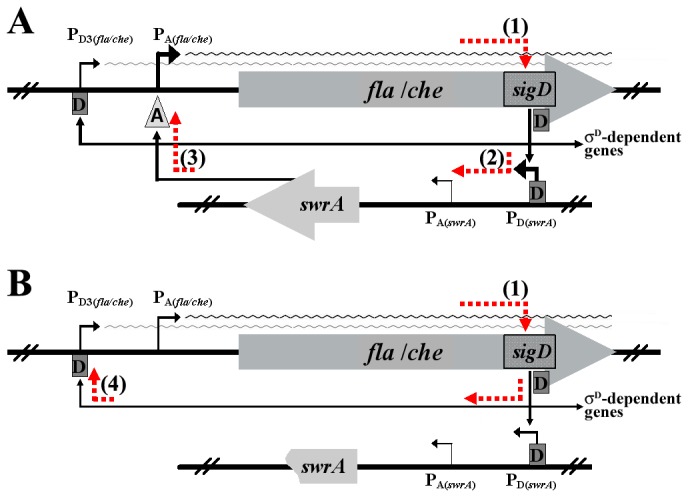
Figure 1. Schematic model for the fla/che operon double-autoregulation.

The chromosomal regions of fla/che and swrA are depicted (not to scale); each locus is preceded by its own σA (PA) and σD-dependent (PD or PD3) promoter indicated by bent black arrows. sigD, the penultimate gene of fla/che, is highlighted. Black arrows indicate direct positive effects. Line thickness is proportional to the strength of the effect of each element. A wavy line represents transcripts originating from each fla/che promoter. Dashed orange arrows mark the autoregulatory loops that can be predicted, which are identified by numbers in parenthesis. (A) In swrA + strains an extremely efficient loop connects SwrA with fla/che expression. It starts with sigD basal transcription from the PA(fla/che) promoter (1); SigD allows transcription of swrA through stimulation of the PD(swrA) promoter (2a). SwrA enhances transcription from PA(fla/che) (3a) closing the circuitry [6, 8]. (B) In swrA - strains the closure of the SwrA-based loop is prevented; in these conditions an ancillary and weaker feedback loop takes over. It starts again with sigD transcription PA(fla/che) (1); SigD directly activates the weak PD3(fla/che) promoter (4) that transcribes fla/che in a positive feedback circuitry. The effect of the weak PD3(fla/che)-based loop can be appreciated only in swrA - strains, although it is also active in swrA + strains (see Fig. 6 and text for details).
