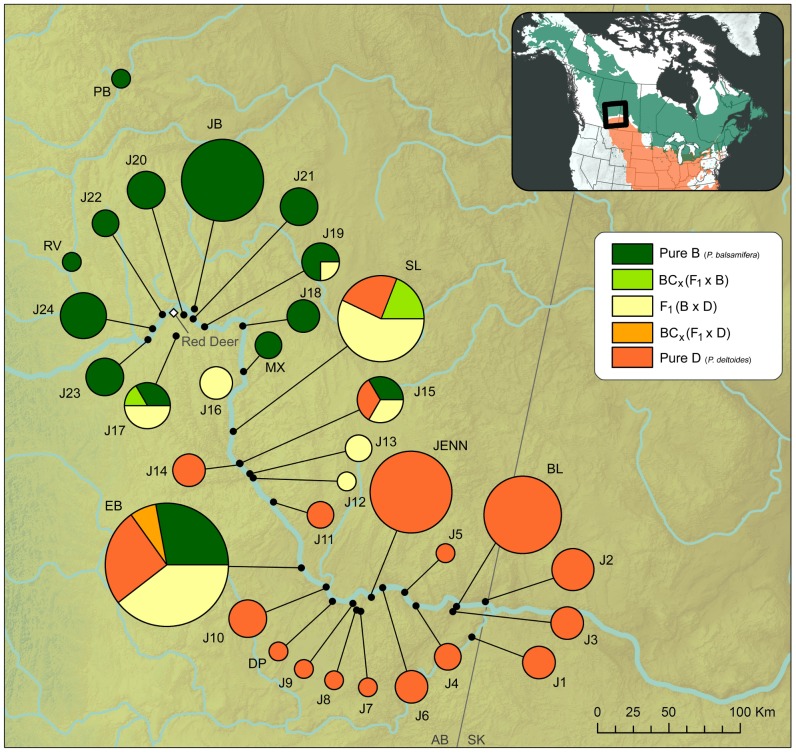
Figure 1. Map of sampling locations in the Red Deer River drainage of southern Alberta, Canada.
Studied populations of Populus are indicated by black dots. The pie charts indicate the relative proportion of individuals in each genotype class (Pure P. balsamifera (B), Pure P. deltoides (D), F1 (BxD), backcross B, and backcross D). The size of each pie chart reflects the number of individuals genotyped in each population. The inset depicts the ranges of P. balsamifera and P. deltoides in North America.

