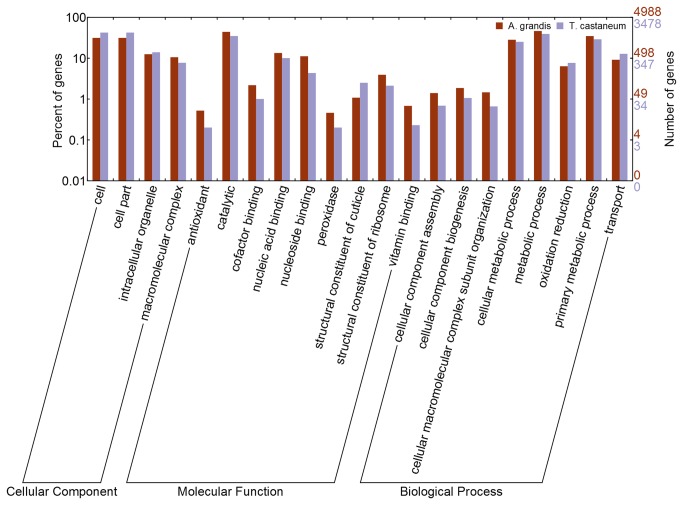
Figure 3. Comparison of the distribution of GO terms.
The X-axis shows subgroups of cellular component, molecular functions and biological process from GO. Distribution of GO terms of gene families of T. castaneum and A. grandis are compared. The Y-axis shows the percentage (left) and the number of genes (right) of the matched Pfam entries.

