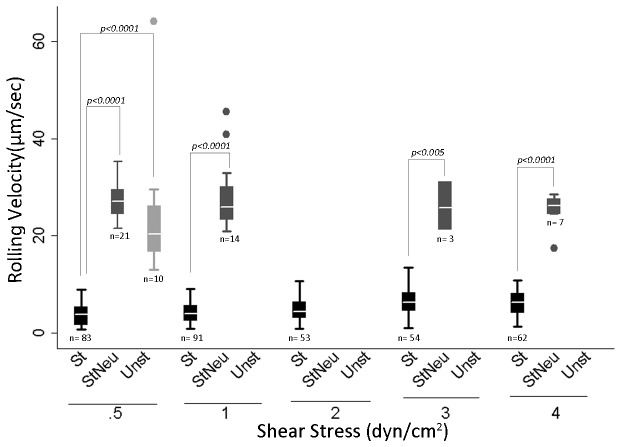
Figure 6. Box plot showing the rolling velocity of MDA cells on IL-1β-stimulated HUVECs.
1X10⁶ MDA cells were perfused over HUVECs. HUVECs used in the experiment were: a) stimulated with 50 ng/ml IL-1β for 4 h, b) unstimulated, and c) stimulated with 50 ng/ml IL-1β for 4h plus 1 h anti-E-selectin neutralizing antibody. Box plot shows the rolling velocities of MDA cells in three different categories of HUVECs. The rolling velocities in IL-1β-stimulated HUVECs ranged from 3.72+ 2.1 to 6.01 +2.45 µm/sec at different shear stresses. The dots represent the outliers. No box plot for the category means that no cells were found rolling at the mentioned shear stress. Box plots represent three separate experiments combined together. n= total number of cells rolling in 10 different fields at a given shear stress in three independent experiments. Notice the reduction in the number of cells (n) rolling in StNeu and Unst versus St category. St= IL-1β-stimulated HUVECs expressing E-selectin. StNeu= IL-1β-stimulated HUVECs incubated with anti-E-selectin neutralizing antibody. Unst= E4ORF1 HUVECs. p< 0.05 was considered significant.

