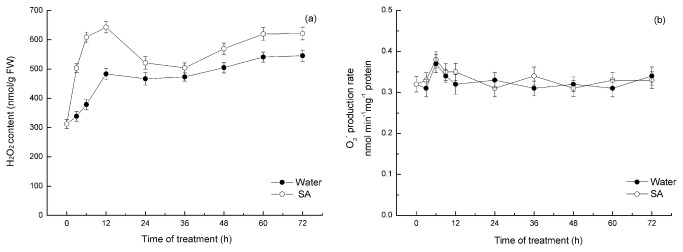
Figure 5. Time course of H2O2 accumulation (a) and O2– production (b) in the hypocotyls of mung beans treated with water or SA.

Explants were incubated with SA or water for 24 h, and the H2O2 levels were monitored at the indicated time points. The mean values shown are the averages of three different experiments. The error bars represent the SE (n=5). The asterisks indicate that the mean values are significantly different compared with the control values (P<0.05). FW, fresh weight.
