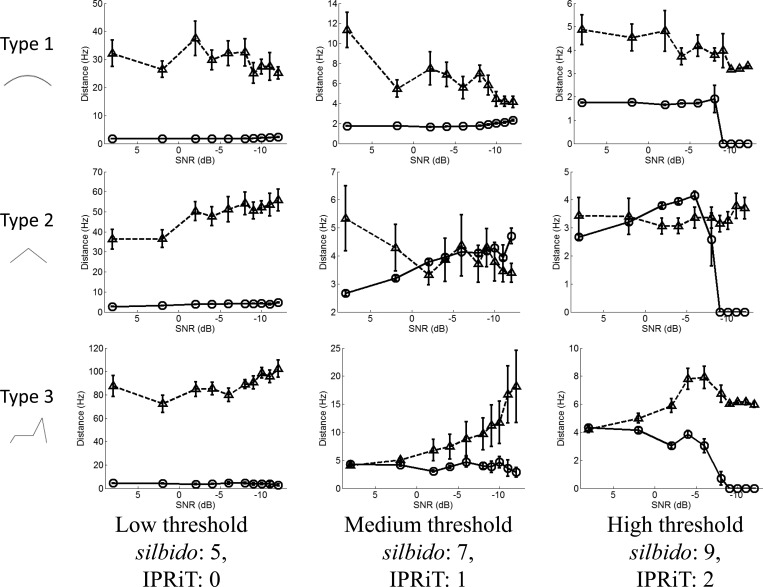
Figure 6.
Fidelity error (y axis) expressed as the mean distance in hertz of near detections from the true signal for varying noise levels (x axis). Rows indicate whistle types 1–3, and columns indicate increasing threshold left to right. Silbido results are indicated by the triangles and broken lines, IPRiT by the circles and solid lines. Error bars indicate standard error.

