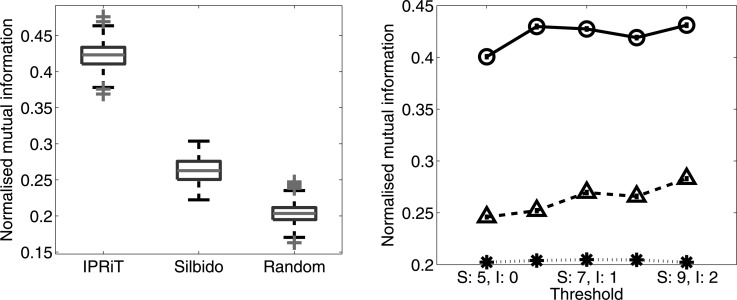
Figure 8.
(Color online) Results of using the two algorithms to cluster dolphin signature whistles. Clustering success is measured as normalized mutual information (y axis), which indicates how well signature whistles analyzed by the two algorithms were assigned to the dolphins that produced them with a value of one indicating perfect clustering. (a) Box plots for the normalized mutual information for the two algorithms and the random control at the lowest threshold. (b) Variation in normalized mutual information with algorithm threshold (silbido varying from 5–9 and IPRiT from 0–2). Silbido is shown as triangles with a broken line, IPRiT as circles with a solid line, and the random control as stars with a dotted line.

