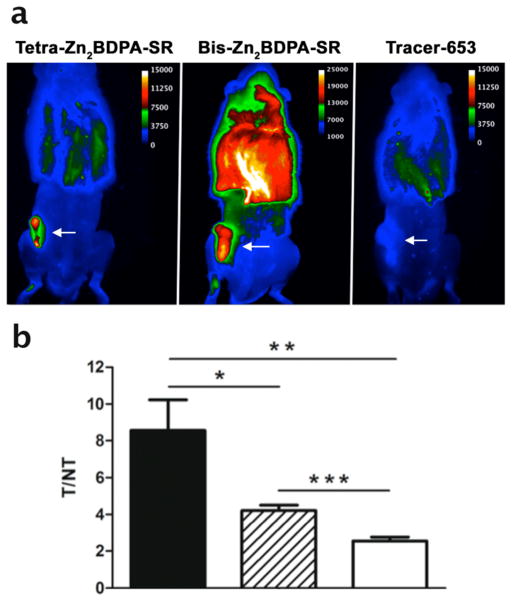
Figure 5.
Representative fluorescence images of Tetra-Zn2BDPA-SR, Bis-Zn2BDPA-SR, and Tracer-653 accumulation in a subcutaneous prostate tumor rat model with tumor indicated by arrow (a). Comparison of Tetra-Zn2BDPA-SR (black bar), Bis-Zn2BDPA-SR (dashed bar), and Tracer-653 (white bar) targeting to prostate tumors (b). Target to non-target (T/NT) values were calculated by region of interest analysis of whole-body images. * P < 0.05, ** P < 0.02, *** P < 0.003. N = 4.

