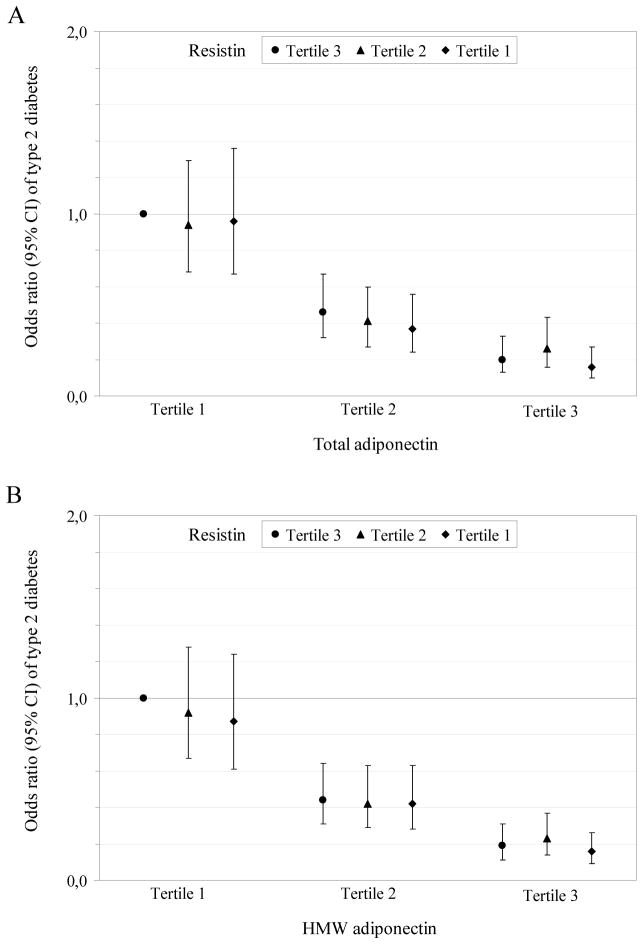
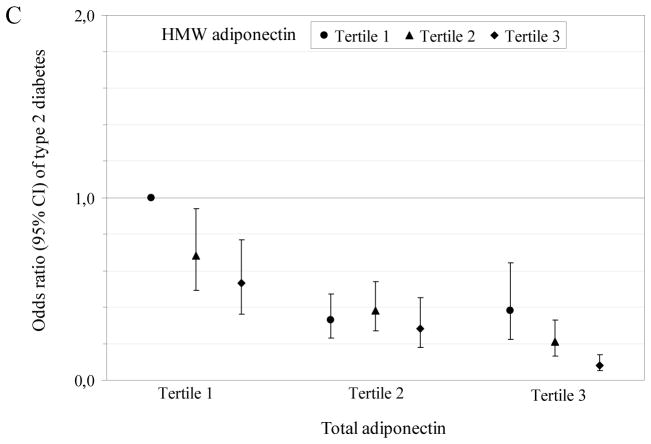
Figure 1. Multivariate-adjusted odds ratio (95% CI) of type 2 diabetes according to the joint classification of adipokines.
Joint analysis of total adiponectin and resistin (A), high-molecular weight adiponectin and resistin (B), and total adiponectin and the high-molecular weight-to-total adiponectin ratio (C). Odds ratios are adjusted for the same variables as in the multivariate model including BMI of table 3. Tertiles were calculated among control subjects and defined as ≤12.55, 12.56–18.36, and >18.36 ng/mL for resistin, ≤14.67, 14.68–21.19, and >21.19 μg/mL for total adiponectin, ≤4.97, 4.98–8.58, and >8.58 μg/mL for high-molecular weight adiponectin, and ≤0.342, 0.343–0.442, and >0.442 for the high-molecular weight-to-total adiponectin ratio. HMW = high-molecular weight.


