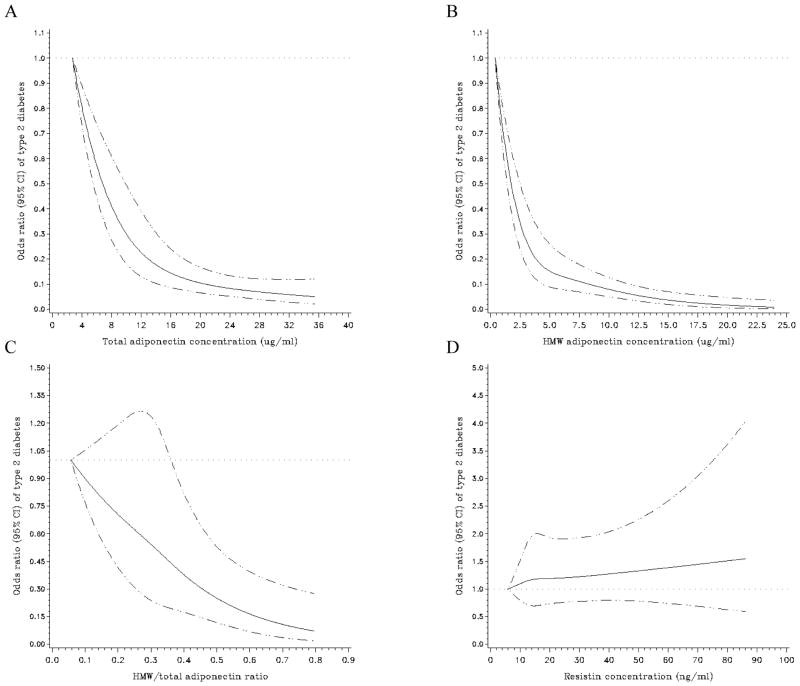
Figure 2. Multivariate-adjusted odds ratio (95% CI) of type 2 diabetes according to continuous adipokine concentrations.
Spline regression models to examine the possible non-linear relation of total adiponectin (A), high-molecular weight adiponectin (B), the high-molecular weight-to-total adiponectin ratio (C), and resistin (D) to type 2 diabetes (adjusted for same variables as in the multivariate model including BMI of table 3). The solid black line represents odds ratios and the dotted lines represent 95% CIs. Women with extreme low or high adipokine concentrations (<1st or >99th percentile) were excluded from these analyses (n=41 for total adiponectin, n=42 for high-molecular weight adiponectin, n=43 for the high-molecular weight-to-total adiponectin ratio, and n=42 for resistin). HMW = high-molecular weight.

