
Figure 7.
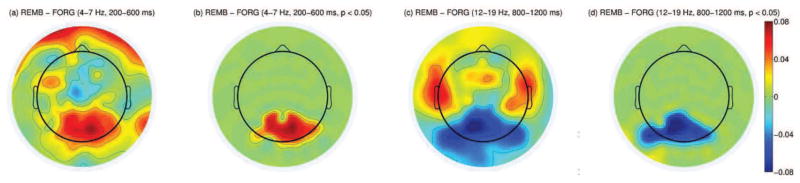
(a): Difference in theta power between the remembered and forgotten trials between 200–600 ms after stimulus onset (log(μV2)). (b): Same topography as in (a) but masked by the spatial pattern of the most significant cluster resulting from cluster-based analysis across all subjects (p < 0.05). (c): Difference in low beta power between the remembered and forgotten trials between 800–1200 ms after stimulus onset. (d): Same topography as in (c) but masked by the spatial pattern of the most significant cluster resulting from cluster-based analysis across all subjects (p < 0.05).