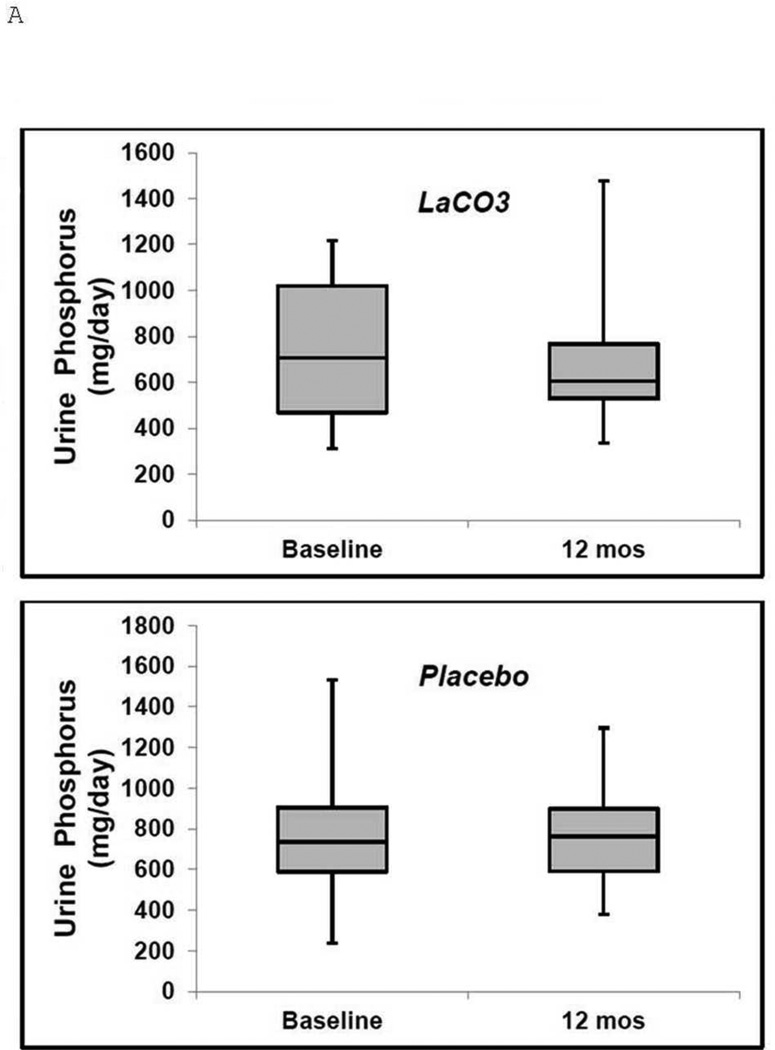
Figure 3. Urinary phosphate and FGF23 levels in the LaCO3 and placebo groups at baseline and at 12 months.
Boxplot representation of (A), Urinary Phosphate and (B), FGF23 levels at baseline and 12 months. Median values are the horizontal lines within the shaded areas. The shaded areas represent the 75th (top) to 25th (bottom) percentiles, and the vertical lines with whiskers represent the full range.


