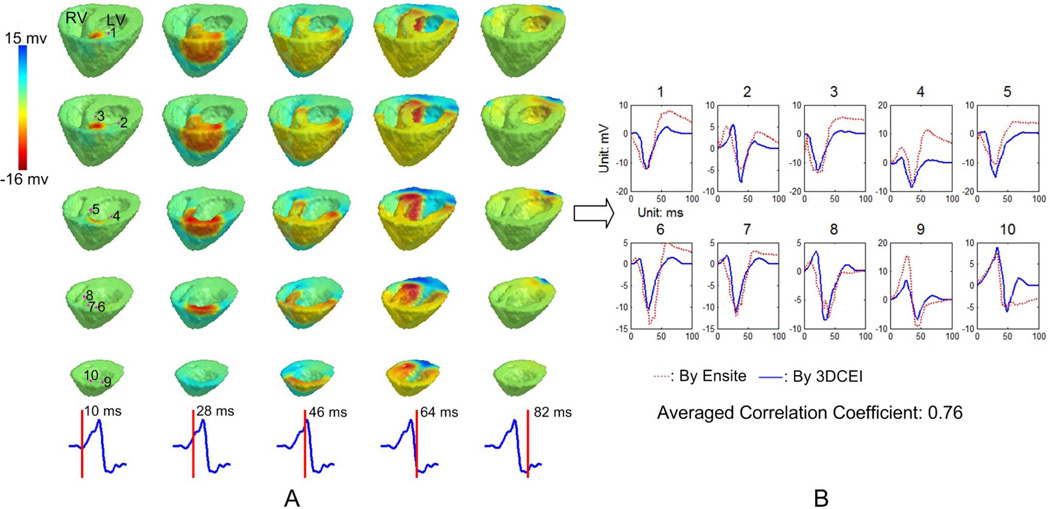
Fig. 3.
A: The reconstructed transmural extracellular potentials by 3DCEI when pig #1 is paced at LV middle anterior. The iso-potential maps are shown on different horizontal levels from base to apex (each column), and in time sequence. The time instant after pacing corresponding to each column is indicated on the lead II ECG waveform. B: The samples of the estimated endocardial electrograms compared with the corresponding output of the NCM system. The endocardial locations where the estimated electrograms are displayed are indicated in the first column of panel A.

