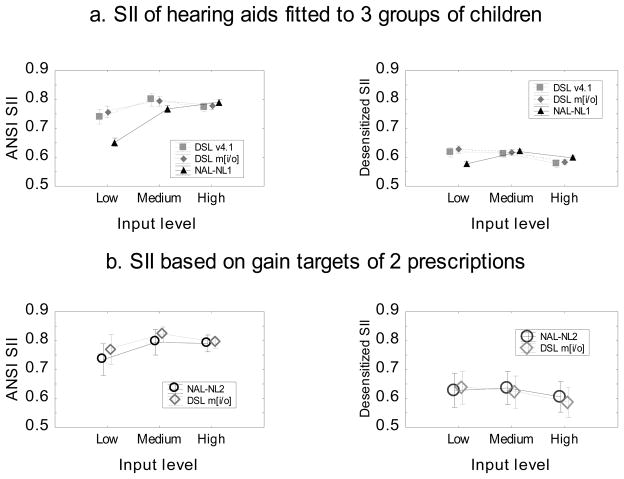
Figure 1.
Figure 1a depicts mean SII vales for groups of children fitted according to NAL-NL1 (filled triangles), DSL v4.1 (filled squares) or DSL m[i/o] (filled diamonds) at low, medium and high input levels. Figure 1b depicts mean SII values for target gains prescribed by the NAL-NL2 (open squares) and the DSL m[i/o] (open circles) for 57 audiograms. The left panels show ANSI SII values, and the right panels show Desensitized SII values that included hearing loss desensitization. Vertical bars denote 0.95 confidence intervals.

