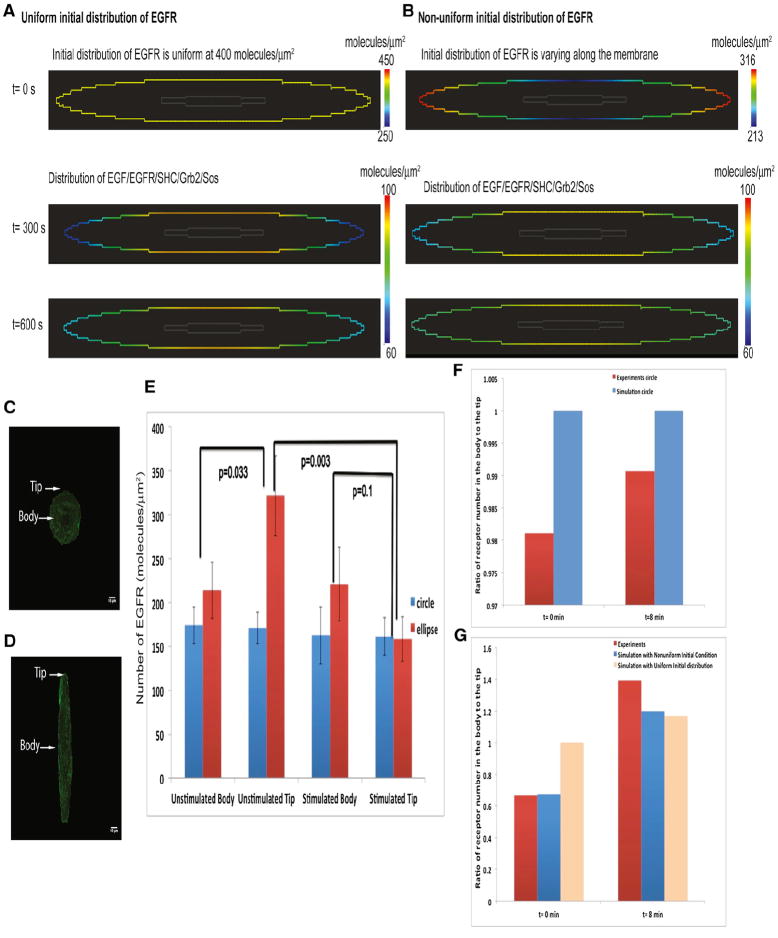
Figure 4. Numerical Simulations and Experiments on the Membrane Distribution of EGFR-eGFP in Circular and Elliptical COS-7 Cells.
(A) Simulation of the spatial distribution of active EGFR-eGFP at 5 and 10 min. The concentration of EGFR is higher in the body than in the tips. Please note that this simulation utilizes signaling components binding to the plasma membrane from both the outside (EGF) and inside (SHC and GRB2) of the cell (see Figure S1E). The initial distribution of EGFR is uniform in this case.
(B) Simulations of the spatial distribution of active EGFR-eGFP at 5 and 10 min. The initial distribution of EGFR is nonuniform in this case. The concentration of EGFR is higher in the body than in the tips.
(C) Representative circular cell transfected with EGFR-eGFP. Arrows indicate the region of the plasma membrane where body and tip measurements were taken.
(D) Representative elliptical cell used for FCS analysis. Arrows indicate the region of the plasma membrane where body and tip measurements were taken.
(E) Experiments determining levels of EGFR-eGFP in the body or tip of elliptical cells (n = 14). Numerical values were extracted from the autocorrelation function fit to fluorescence correlation data for unstimulated data. Cells were measured after 12 hr of serum starvation; for stimulated data, measurements were started immediately after addition of 100 ng/ml EGF and were completed within 8 min. Data ± SD are shown. p values indicate statistical difference according to Mann-Whitney tests.
(F) Ratio of receptor number at the tip to body in simulations and experiment in circular cells.
(G) Ratio of receptor number at the tip to body in simulations and experiment in elliptical cells.

