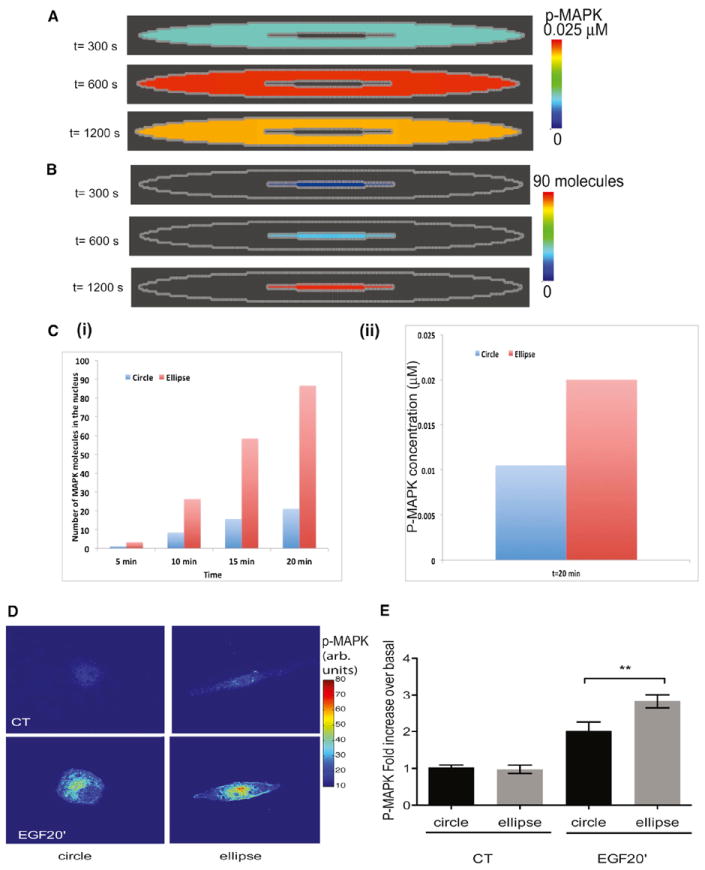
Figure 5. Levels of Activated MAPK1,2 in the Nucleus of Circular and Elliptical Cells.

(A) Simulations of the activation of MAPK1,2 in the cytoplasm. The concentration of MAPK1,2 in the cytoplasm follows the kinetics shown in Figure S4—first increasing and then attaining a steady value before decreasing. The spatial distribution of MAPK1,2 in the cytoplasm appears uniform because of the high diffusion coefficient of MAPK1,2 in the cytoplasm. Later time points are shown for comparison with experiments
(B) Simulations of active MAPK1,2 in the nucleus. The concentration of MAPK1,2 increases with time in the nucleus. The spatial distribution of MAPK1,2 in the nucleus appears uniform because of the high diffusion coefficient of active MAPK within the nucleus.
(C) (i) From simulations, the number of molecules of active MAPK1,2 in the nucleus is higher in elliptical cells when compared to the number of active MAPK in circular cells. (ii) The concentration of p-MAPK1,2 in circular and elliptical cells at 20 min is shown from simulations.
(D) Elliptical COS7 cells stimulated with EGF show an enhanced accumulation of phosphor- MAPK. p MAPK1,2 immunostained cells are shown as color-coded grayscale images. Original pseudocolored images are shown in Figure S5.
(E) EGF-treated cells show a higher concentration of p-MAPK1,2 in elliptical cells than in circular cells. Fluorescence intensity ratios of nuclear p-MAPK1,2/MAPK1,2 were plotted as mean ± SEM (n = 15–31; p = 0.0069; one-tailed t test)
See also Figures S4 and S5.
