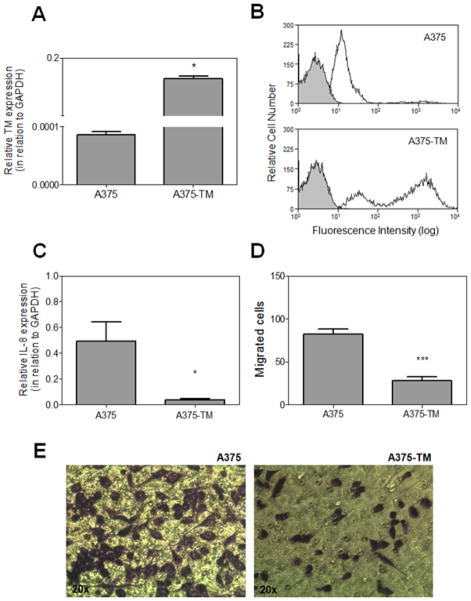
Figure 4. Effect of enforced TM expression on A375 phenotype.
(A) qRT-PCR analyses confirmed the efficient TM transfection in A375-TM cells as compared to non-transfected A375 cells. Bars represent mean ± SD of three independent experiments. *p <0.05 (Student’s t-test). (B) Analysis by flow cytometry of TM expression. Black line represents staining with monoclonal anti-human TM antibody labeled with allophycocyanin. Gray region represents control cells with no staining. Representative histograms of five independent experiments are presented. (C) qRT-PCR analyses of IL-8 expression. Bars represent mean ± SD of five independent experiments. * p < 0.05 (Student’s t-test). (D) A375 migration was determined by transwell assay as described in “Materials and methods”. *** p < 0.0001 (Student’s t-test). Each bar represents the number of migrated cells per well (n=3), counted in 4 fields. (E) Representative pictures of each cell line.

