
Figure 5.
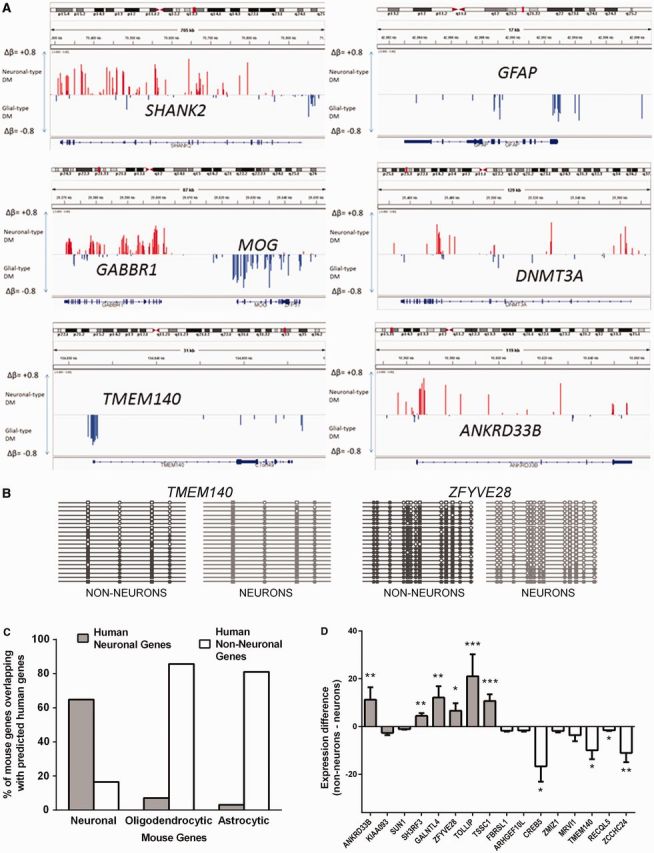
Differential DNA methylation profile predicts cell-specific gene expression. (A) Depiction of differential DNA methylation signatures at individual gene loci. Visualization is made using IGV (62). Shown are methylation profiles for several known neuronal (SHANK2, GABBR1, DNMT3A) or glial (MOG, GFAP) genes, as well as for putative non–neuron-specific (TMEM140) and neuron-specific (ANKRD33B) genes. Red and blue bars represent Δβ for sites that are undermethylated in neurons or nonneuronal cells (denoted here as ‘glial’), respectively. (B) Validation of the results obtained in HM450K array using bisulfite sequencing. Between 18 and 20 clones were analyzed for each fragment and cell type. Shown are results for TMEM140 (genomic location: 7: 134 833 108–134 833 366), predicted to be expressed mostly in nonneuronal cells, and ZFYVE28 (genomic location: 4: 2 303 549–2 303 774), predicted to be expressed mostly in neurons. CpG sites that are present in the HM450K array are denoted by squares; other CpG sites are denoted by circles. Methylated sites are filled. Methylation profiles obtained from neuronal and nonneuronal nuclei are shown in light gray color and dark gray color, respectively. (C) Cellular specificity of genes predicted by their DM in the human OFC highly correlates with cell-specific expression of these genes in the mouse brain. Shown is the percent of overlap between human neuron- and non–neuron-specific genes (predicted from their differential methylation in this study) and mouse neuron-, astrocyte- and oligodendrocyte-specific genes identified in flow cytometry–sorted cellular populations by (61). (D) We carried our qPCR in four individuals using RNA specimens obtained from the laser microdissected neurons (from deep layers of gray matter) and small areas of adjacent white matter in the PFC (see Methods and Supplementary Figure S19). Shown are fold differences that represent neuronal to white matter (positive values) or white matter to neuronal (negative values) gene expression of genes for which a cell-specific expression pattern was predicted from the methylation data. Gray bars, genes with predicted neuron-specific expression; white bars, genes with predicted non–neuron-specific expression. *P < 0.05; **P < 0.01; ***P < 0.001.