Figure 3.

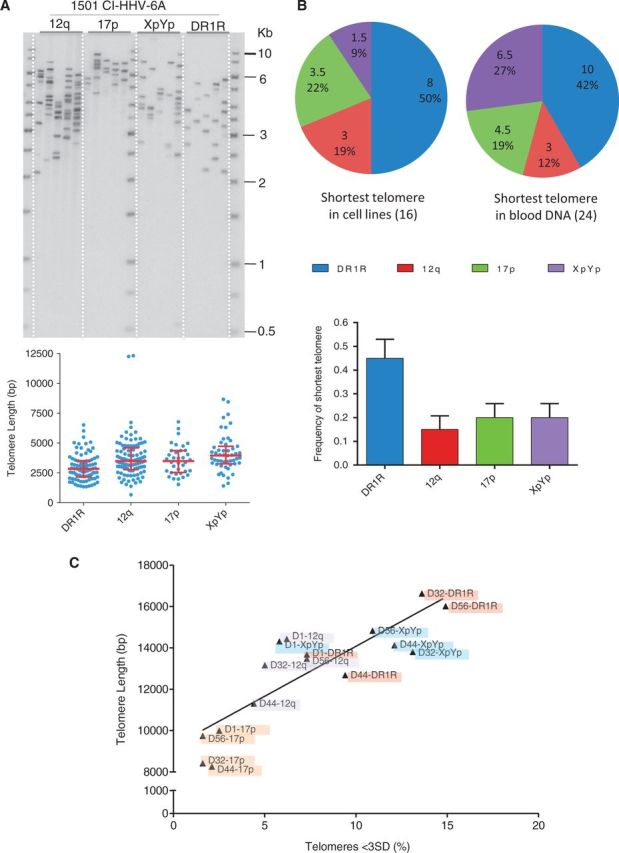
Telomere length analysis in CI-HHV-6 carriers. (A) STELA was used to measure telomere length at 12q, 17 p, XpYp and on the end of the virus (DR1R) in CI-HHV-6 carriers. It shows a representative STELA-Southern blot on blood DNA from one CI-HHV-6 A carrier (1501) and below the scatter plots of the data obtained from several blots. The median and inter-quartile ranges are shown as red lines. (B) The median values for each of the four telomeres measured were ranked by length in DNAs from 16 LCLs and 24 blood DNAs from CI-HHV-6 carriers. The proportion of the samples in which each telomere is the shortest is shown in pie charts for the LCLs and blood DNA samples. The histogram of the combined data shows that the shortest telomere frequency (+SEM) is different between the chromosome ends (Kruskal–Wallis test P < 0.0117). (C) Relationship between telomere length and the frequency of short telomere molecules in the male germline. The short (outlier) telomere molecules, shorter than 3 standard deviations from the mean (<3SD), were counted as a proportion of the total molecules analysed for each telomere in four sperm donors and plotted against mean telomere length (Table1).
