
Figure 2.
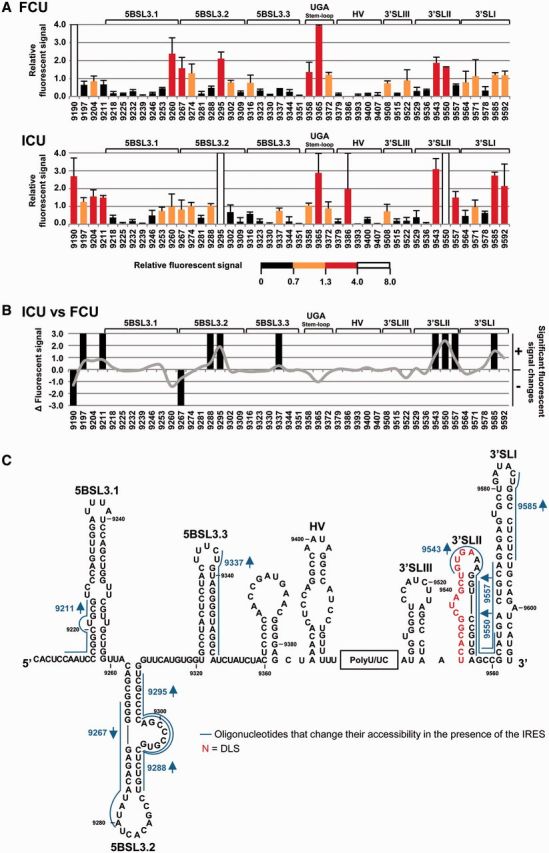
Structural analysis of the HCV genomic 3′ end by antisense DNA oligonucleotide microarrays in the presence of the IRES region. (A) Normalized hybridization signal of transcripts FCU and ICU plotted against each oligonucleotide (mean fluorescence hybridization signal ± standard deviation for three independent assays). The color code shows the four accessibility levels, as described in ‘Materials and Methods’ section. (B) Differences in fluorescence values for constructs ICU versus FCU with respect to different oligos are represented as a solid gray line. Significant variations (P ≤ 0.05) are qualitatively indicated as gain (+) or loss (−) of accessibility. Functional RNA domains are shown. (C) Figure shows the secondary structure of the CRE and the 3′UTR region and includes those antisense oligonucleotides that change their accessibility for the transcript ICU compared with FCU. Red nucleotides: dimerization linkage sequence (DLS).