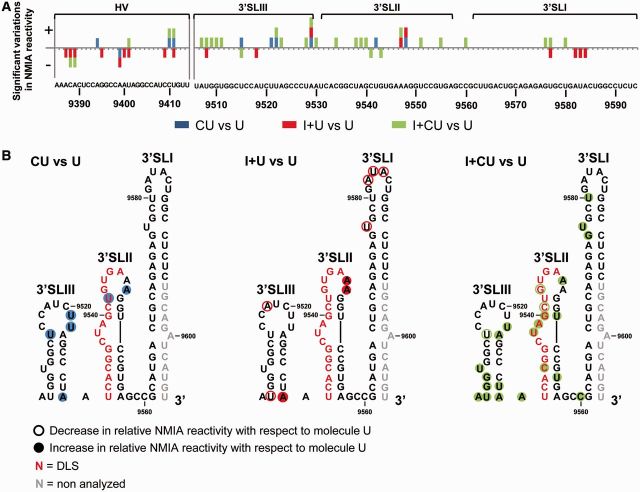
Figure 7.
SHAPE analysis shows rearrangement events in the HCV 3′X-tail influenced by the CRE and the IRES regions. (A) Graph shows significant (P ≤ 0.05) gains (+) or losses (−) in NMIA reactivity for the 3′UTR element in the presence of the CRE (CU), the IRES (I + U) or both elements (I + CU) with respect to transcript U. Color code is as noted in Figure 6A. Functional domains are indicated. (B) Summary of significant reactivity differences (P ≤ 0.05) observed in SHAPE profiles for the molecules CU, I + U and I + CU with respect to transcript U. Filled circles: significant increase (P ≤ 0.05) in NMIA reactivity; open circles: significant reduction (P ≤ 0.05) in NMIA reactivity. Red nucleotides: dimerization linkage sequence (DLS). Gray residues: not analyzed.

