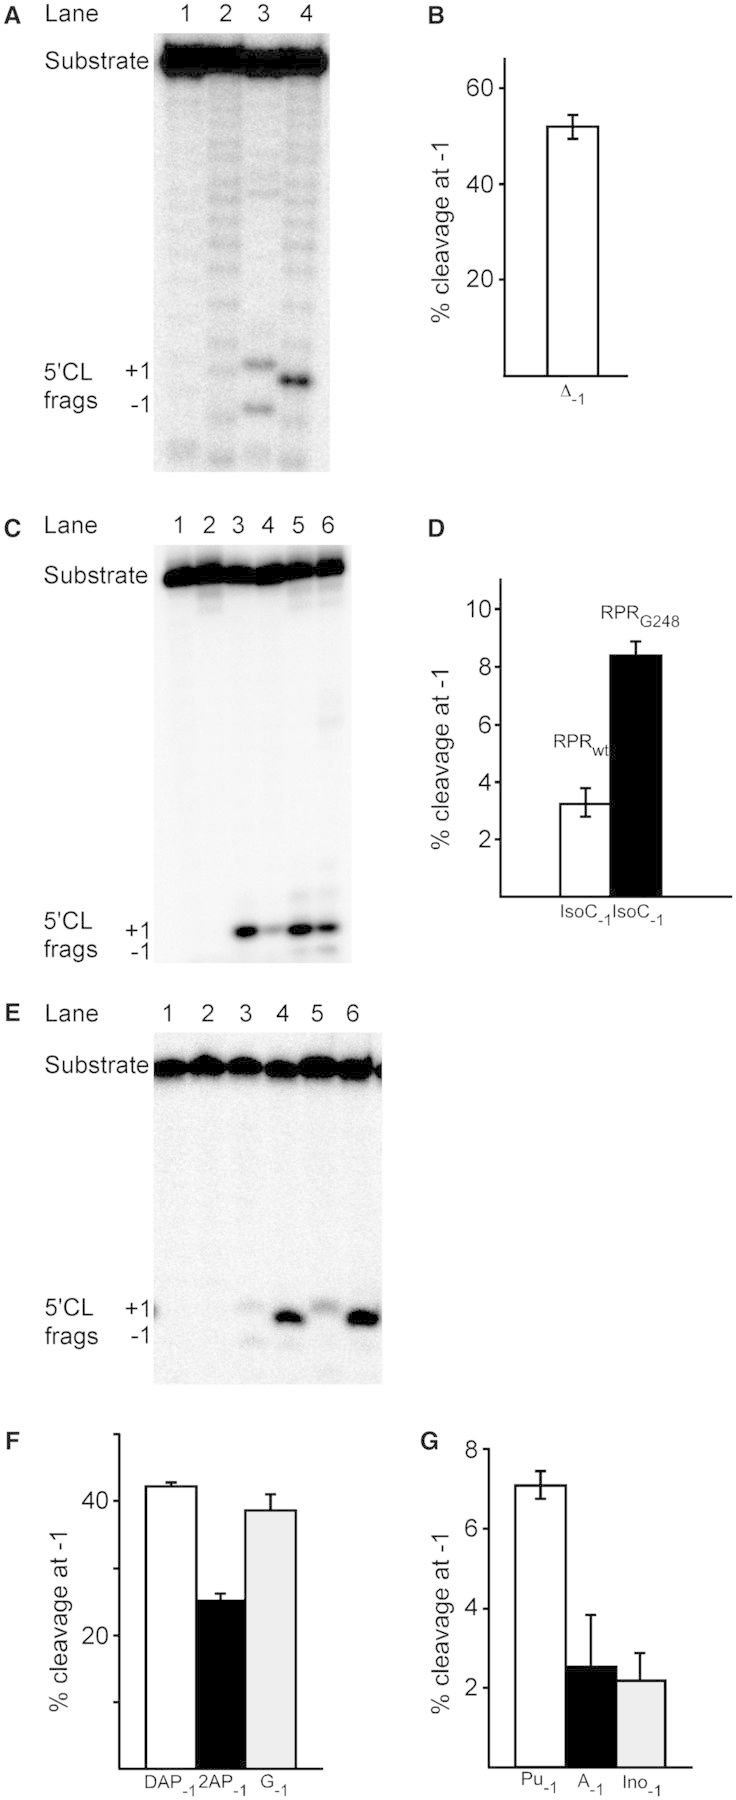
Figure 2.

Cleavage of pMini3bp variants with Eco RPR. (A) pMini3bpUG and pMini3bpAbasicG; the reaction was performed at 37°C in buffer C containing 800 mM Mg2+ (see ‘Materials and Methods’). Lanes 1 (pMini3bpAbasicG) and 2 (pMini3bpUG), controls incubation without Eco RPRwt; lanes 3 (pMini3bpAbasicG) and 4 (pMini3bpUG) incubation with Eco RPRwt for 1179 min and 20 s, respectively. The concentrations of Eco RPRwt and substrate were ≈0.8 and 0.02 µM, respectively. The 5'CL frags indicate the 5′ cleavage fragments generated after cleavage at +1 and −1. The difference in migration of the +1 cleavage fragments in lanes 3 and 4 is likely because of the absence of the −1 nucleobase in the 5′ cleavage product after cleavage of pMini3bpAbasicG at +1. For experimental details see ‘Materials and Methods’. (B) Frequency of cleavage of pMini3bpAbasicG at the alternative site −1 with Eco RPRwt at 800 mM Mg2+. For the calculations of the percentage of cleavage, we used the 5′ cleavage fragments and the data are the mean and experimental errors of at least three independent experiments. The error bars indicate experimental errors and the frequencies of cleavage at −1 were calculated as described previously (30). For experimental details, see figure legend 2A. (C) Cleavage of pMini3bpUG and pMini3bpIsoCG with Eco RPRwt and Eco RPRG248; the reaction was performed at 37°C in buffer C containing 800 mM Mg2+ (see ‘Materials and Methods’). Lanes 1 (pMini3bpUG) and 2 (pMini3bpIsoCG), controls incubation without Eco RPR for 90 min; lanes 3 and 4, pMini3bpUG incubated with Eco RPRwt and Eco RPRG248, respectively, for 20 s; lanes 5 and 6, pMini3bpIsoCG incubated with Eco RPRwt (60 min) and Eco RPRG248 (90 min), respectively. The concentrations of Eco RPR and substrate were ≈0.8 and 0.02 µM, respectively. The 5'CL frags indicate the 5′ cleavage fragments generated after cleavage at +1 and −1. (D) Frequency of cleavage of pMini3bpIsoCG at the alternative site −1 (mean and experimental errors of at least three independent experiments) with Eco RPRwt and Eco RPRG248 at 800 mM Mg2+. For experimental details and calculations, see figure legends 2B and 2C. (E) Cleavage of pMini3bpGG and pMini3bpAG with Eco RPRwt in the absence and in the presence of C5. Lanes 1 (pMini3bpGG) and 2 (pMini3bpAG), controls incubation without Eco RPRwt and C5 for 180 min; lanes 3 (pMini3bpGG) and 4 (pMini3bpAG) cleavage without C5 for 180 min; lanes 5 (pMini3bpGG) and 6 (pMini3bpAG) cleavage with C5 for 1 min. 5′ CL Frags +1 and −1 mark the migrations of the 5′ cleavage fragments. The reactions were carried out at 37°C and 800 mM Mg2+ and 10 mM Mg2+ as described in ‘Materials and Methods’. In the absence of C5, the concentration of Eco RPRwt was 3.2 µM, whereas it was 0.002 µM in its presence. The substrate concentration was 0.02 µM. (F) Percentage of cleavage at −1 for substrates carrying 2;6-diaminopurine (DAP), 2-aminopurine (2AP) or guanosine (G) at −1 as indicated. The reactions were performed in the absence of C5 in buffer C at 800 mM Mg2+ as described earlier in text and in ‘Materials and Methods’. The calculations were done as described in figure legend 2B. (G) Percentage of cleavage at −1 for substrates carrying purine (Pu), adenosine (A) or inosine (Ino) at −1 as indicated. The reactions were performed in the absence of C5 in buffer C at 800 mM Mg2+ as described earlier in text and in ‘Materials and Methods’. The calculations were done as described in figure legend 2B.
