
Figure 5.
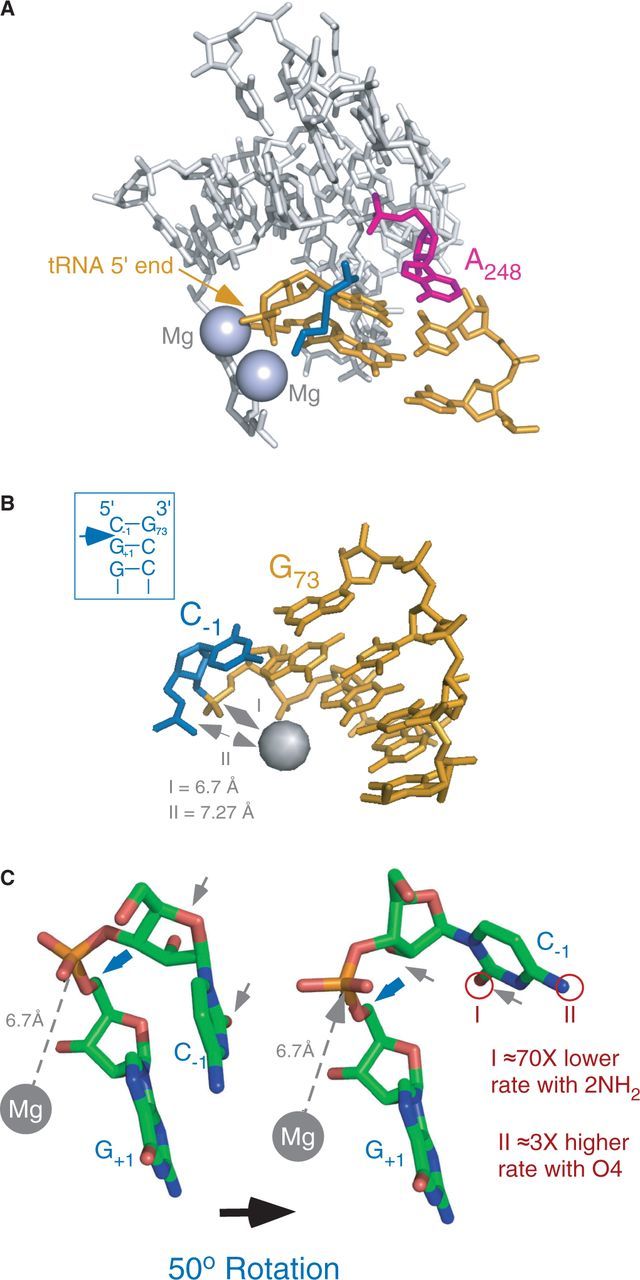
The structure of the RPR active site and model of the RNase P cleavage site. (A) The active site of RPR from the PDB structure 3OKB (11). Residues G+1 of the 5′ matured tRNA and A248 (E. coli numbering) are marked as indicated. The grey spheres corresponds to the Mg2+ ions observed in the structure, and the blue structure represents the 5′ leader that was soaked into the crystal. (B) Model of the RNase P cleavage site with C−1/G+73 and G+1/C+72. The model is part of the SRP RNA structure [PDB code 1LNT; (40)]. The phosphorous atom to be attacked is marked with the grey dashed double arrow. The light blue sphere represents Mg2+ bound in the minor groove and is positioned at a distance of 6.7 Å relative to phosphorous atom I, and 7.27 Å relative to phosphorous atom II; I and II are referred to as P(+1) and P(−1) in the main text. This distance allows for a nucleophilic attack on P(+1) by an activated H2O coordinated to a divalent metal ion (41,42). The boxed hairpin structure shows the sequence of SRP RNA that mimics the RNase P cleavage site. The blue arrow marks the cleavage site. (C) Model of the RNase P cleavage site showing the conformational change in the substrate that facilitates the nucleophilic attack on P(+1). The model was prepared using the structure shown in panel B and rotating the P-O5′ phosphoester bond (marked with a blue arrow) 50°. The rotation displaces the pro-Sp non-bridging oxygen and exposes the P(+1)-atom to an inline hypothetical nuclephilic attack by a Mg2+-activated H2O (grey dashed arrow). The grey arrows mark the 2′OH and O2 of C−1, and I and II refer to the changes in cleavage rates as a result of changing O2 to 2NH2 and O4 to 4NH2, respectively.