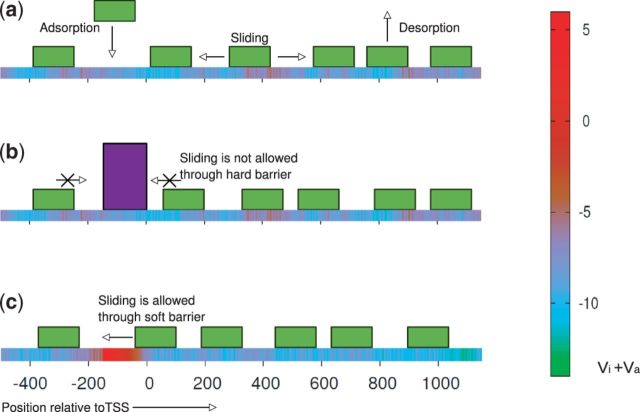
Figure 1.
Schematic depiction of the model: (a) Three kinetic events: nucleosome binding, dissociation and sliding. The sequence dependent potential is represented by the color gradient as indicated in the sidebar. (b) A hard barrier (purple) prevents nucleosome binding and sliding through the TSS. (c) The soft barrier is the region with highly positive (red) sequence-dependent potential such that nucleosomes are repelled.

