
Figure 2.
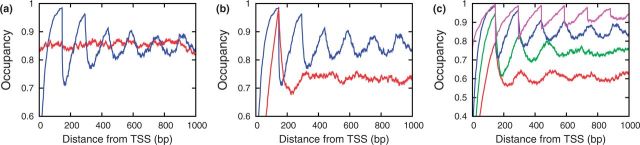
Effect of a hard barrier and ATPase activity. Nucleosome occupancy on a homogeneous DNA (a) in the presence (blue) and in the absence (red) of a barrier – ATPase activity here is specified through active sliding rate 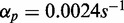 and active nucleosome removal parameter
  ; (b) in the presence of barrier but with (blue,
  ,
, 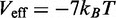 ) and without (red,
  ,
,  ) ATPase activity; (c) in the presence of barrier for different values of nucleosome removal – from bottom to top
  (red),
  (green),
  (blue),
  (pink).