
Figure 3.
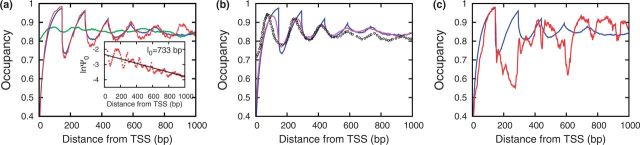
Effect of sequence: (a) Nucleosome occupancy in the presence of a hard barrier with homogeneous DNA (red), averaged over 100 genes in the presence of hard barrier (blue) and averaged over 100 genes in absence of any barrier (green). Inset: the gene-averaged deviation  of profiles with and without barrier decays on a
  bp scale (see text). (b) Comparison of average occupancy data (blue: hard barrier; pink: soft barrier) with experimental data (open circles). (c) Nucleosome occupancy averaged over 100 genes with hard barrier (blue) and nucleosome occupancy of an individual gene with hard barrier (red; YGR034W, Chromosome VII). All results are for
 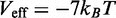 and
and 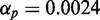 s−1.
s−1.