
Figure 4.
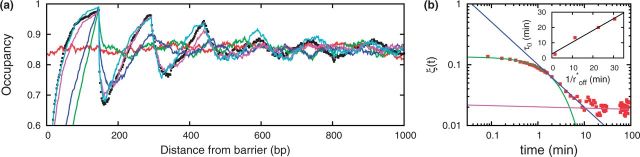
(a) Nucleosome occupancy along homogeneous DNA (uniform potential of −7 kBT) for different times after placing a hard barrier. Black dots represents steady state occupancy in presence of barrier. Just before placing the barrier (red), we see uniform occupancy. After 10 s (green), there is little positioning except immediately adjacent to the barrier. After 1 min (blue), positioning starts to appear. After 10 min (pink), the occupancy looks similar to the steady state occupancy (black dots), and after 30 min (cyan), the occupancy is nearly the same as the steady state occupancy. All curves are averaged over 1000 simulations. (b) Deviation of occupancy from its steady state value as a function of time (see text). Inset: The timescale over which positioning oscillations appear ( ) is essentially equal to the timescale for active nucleosome eviction (
 ).
).