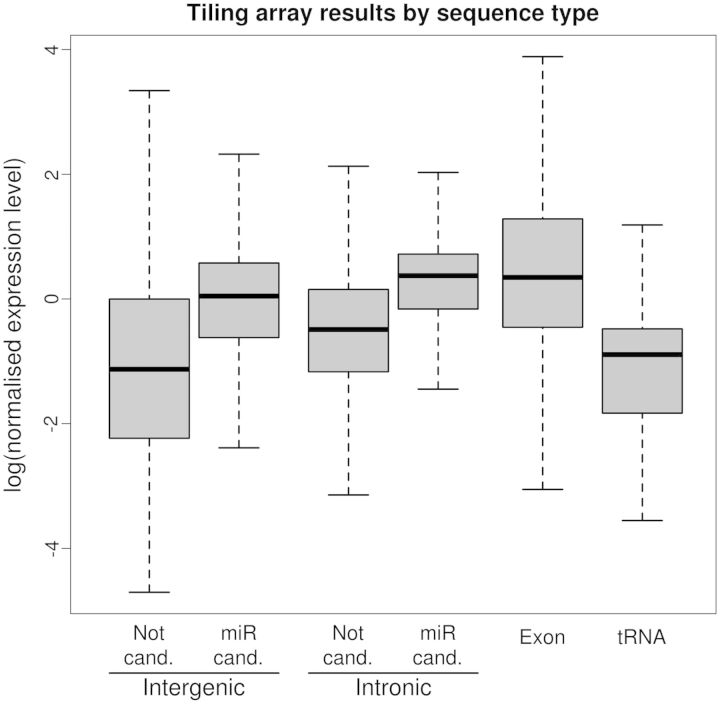
Figure 2.
Expression level of various sequence sets extracted from a whole-genome tiling array experiment. The predicted pre-miRNA (‘miR cand.’, lines 2 and 4) are compared with the other sequences (‘Not cand.’, lines 1 and 3) of the same genomic origin (‘Intergenic’ or ‘Intronic’). Exons and tRNAs are also displayed. Each ‘miR cand.’ line is significantly higher than the corresponding ‘Not cand.’ line.

