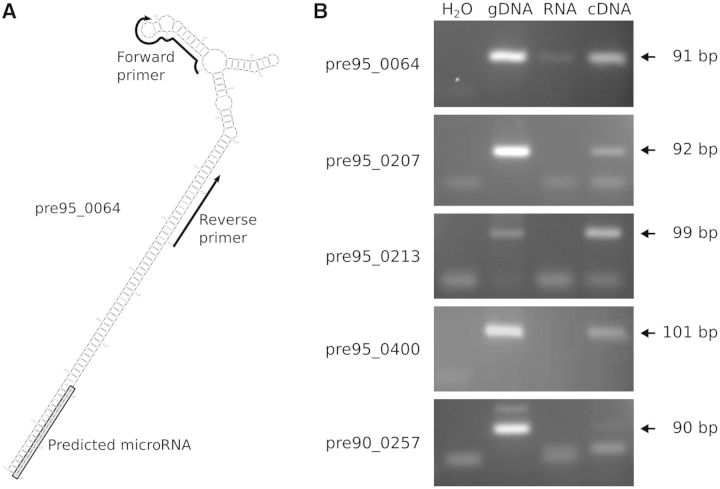
Figure 4.
Pre-miR detection by RT-qPCR amplification. (A) Example of primer design for PCR assay. Oligonucleotides used for the RT-qPCR are shown as arrows, and the predicted miRNA sequence is shaded in gray. To ensure a high specificity, one of the oligonucleotides was designed, when possible, in the terminal loop. (B) Visualization of assay results. For each predicted precursor, the PCR assay was conducted from H2O, gDNA (2.3 ng), total RNAs (40 ng) and cDNAs (40 ng equivalent of total RNAs) and run on a 4% agarose gel. Their predicted size in base pairs is indicated in the right side of the figure. Leftovers of primers or primer dimers are visible in the bottom part of each photography.

