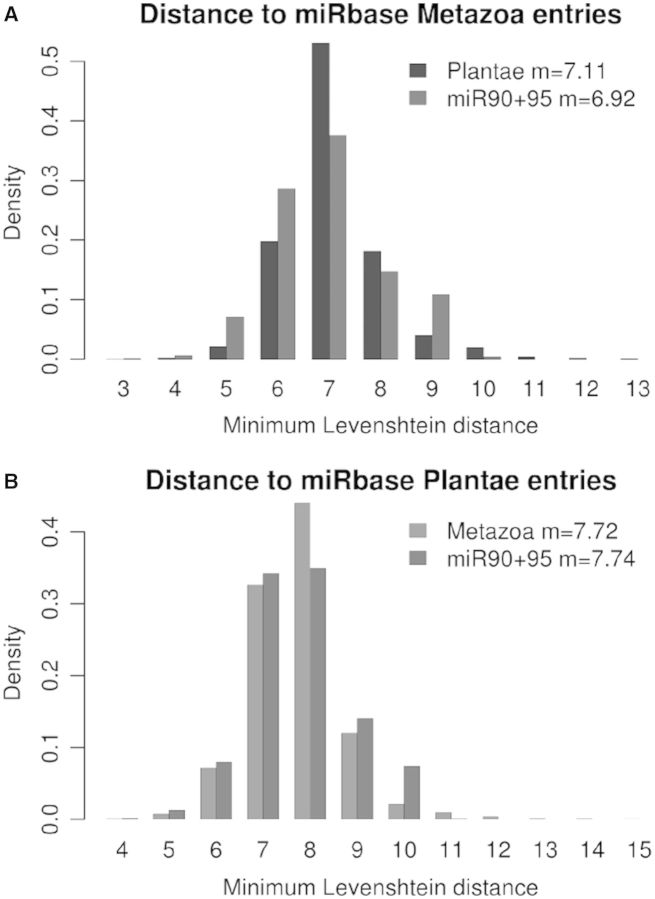
Figure 6.
Comparison between miRNA candidates and miRBase. Each chart shows the distribution of the Leveshtein distance for each sequence to the closest entry in a subset of miRBase. (A) Distance for Viridiplantae and E. siliculosus to Metazoa; (B) Distance for Metazoa and E. siliculosus to Viridiplantae.

