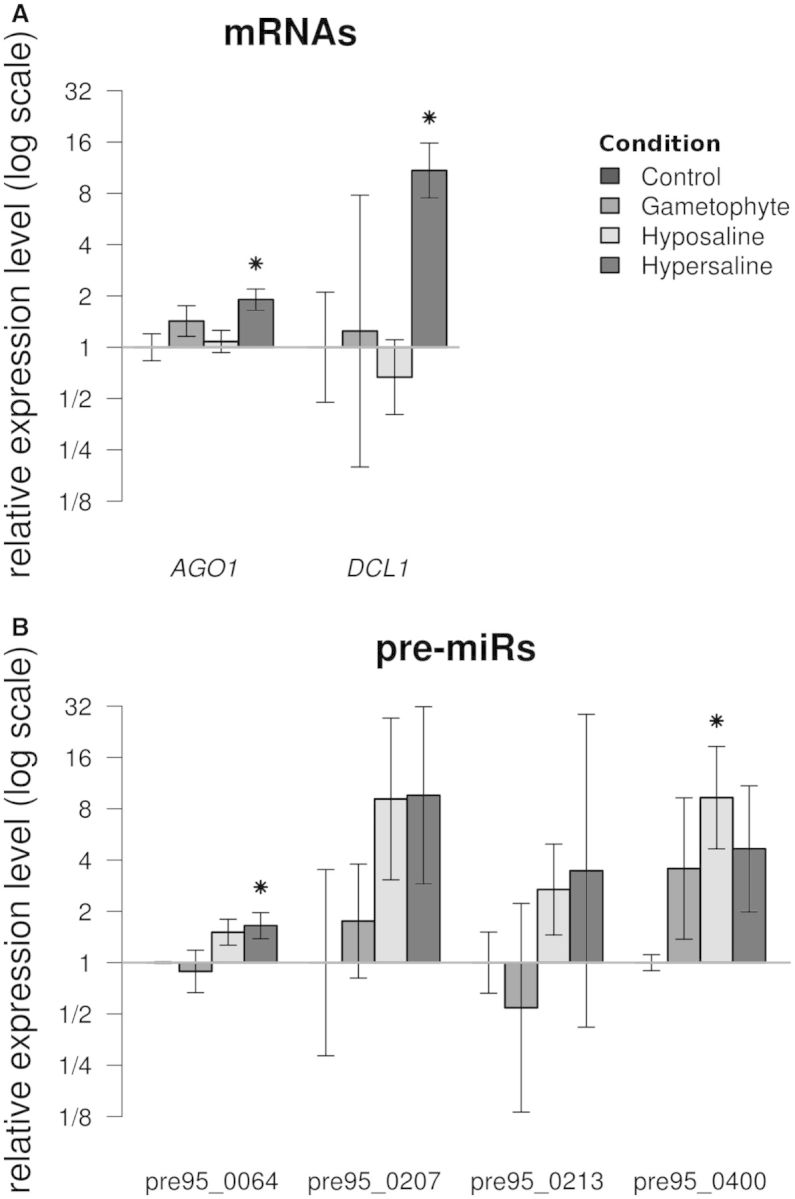
Figure 7.

Transcript levels of miRNA processing proteins, pre-miRs, miRNAs and target genes measured by RT-qPCR in different algal materials. (A) AGO1 and DCL1 cDNAs. (B) Pre-miRs detected in Figure 4. The data are expressed as fold changes relative to the control. ‘Control’: sporophytes grown in normal culture conditions, used to set the reference value at 1; ‘Gametophyte’: gametophytes grown in normal culture conditions; ‘Hypo-saline’ and ‘Hyper-saline’: sporophytes subjected to corresponding osmotic stress conditions. Conditions for which the distribution of replicates values significantly differs from the control distribution (Student t-test, α = 0.05) are denoted by an asterisk.
