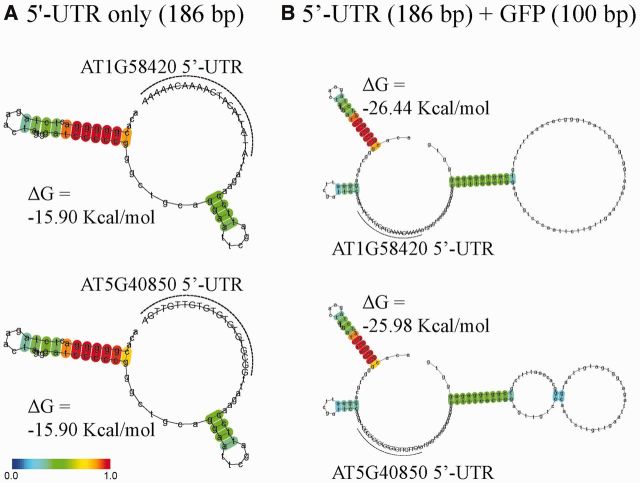
Figure 3.
The secondary structural analysis of the AT1G58420 and AT5G40850 5′-UTRs as representatives of ‘good’ and ‘poor’ 5-UTRs, respectively. (A and B) The entire 5′-UTR consisting of the 165 nt-long 5′-UTR from the expression vector and the 21 nt region of the 5′-UTR from AT1G58420 or AT5G40850 (A), or together with 100 nt GFP-coding region (B) was analysed for the possible secondary structure using centroidfold (http://www.ncrna.org/centroidfold/). Heat colour gradation from blue to red represents the base-pairing probability from 0 to 1. The base-pairing probability is the probability that a pair of bases forms a base pair via hydrogen bonds in the secondary structure. The 21 nt 5′-UTRs from AT1G58420 and AT5G40850 are in capital letters and also indicated by broken lines.

