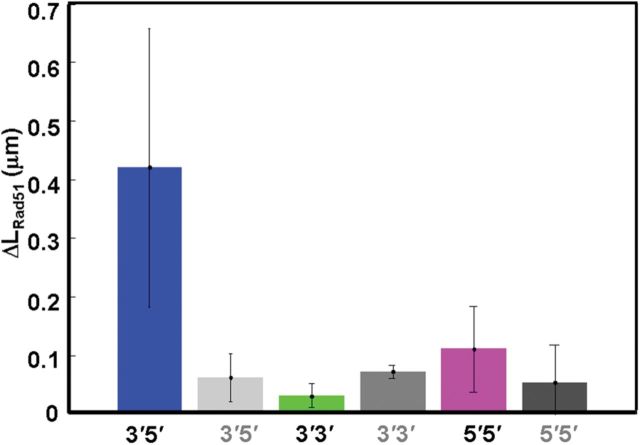
Figure 4.
Bar graphs for ΔLRad51 values between 56 and 58 pN after 120 s, and 1000 nt-filaments; λ dsDNA molecules are pulled 3′5′, 3′3′ and 5′5′ shown in blue, green and magenta, respectively, and controls are shown in gray. In these experiments 1000 nt- Rad51-ssDNA filaments from pcDNA3 were prepared in a buffer containing ATPγS and measured in a buffer containing ATPγS.

