
Figure 5.
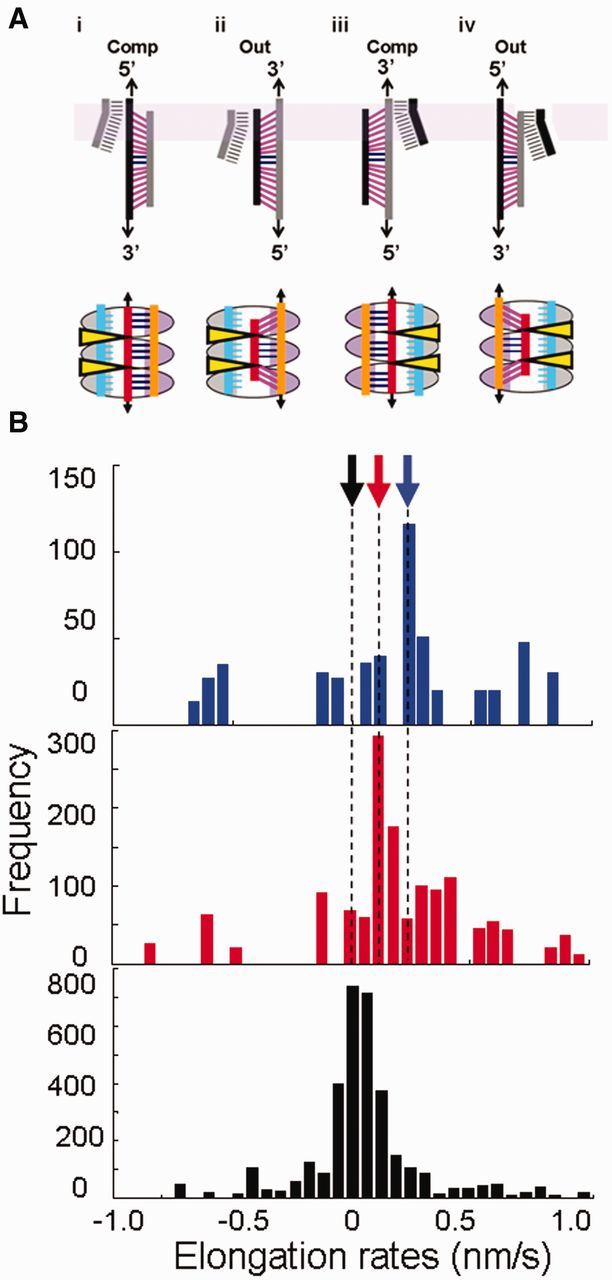
Strand-exchange experiments in the presence of homolog 1000-nt ssDNA bound to Rad51 and full lambda phage dsDNA constructs. (A) Schematic representation of the effect of force applied to different ends of the dsDNA constructs during strand-exchange experiments. The dsDNA is pulled from 3′5′ ends with stressed and unstressed base pairs shown in magenta and blue, respectively. Filaments were obtained from PCR fragments amplified using lambda phage as template and labeled with one phosphorylated primer. The strand containing the phosphorylated end was degraded by lambda exonuclease; each type of filament is shown in gray or black. In the representation of strand exchange in the first row, the Rad51 molecules were omitted for better clarity. The lavender band indicates the GC-rich end in lambda phage dsDNA. The ellipses in the second row indicate Rad51 monomers with site I and site II shown in grey and purple, respectively, and the yellow triangles indicate regions occupied by the L1 and L2 loops. The outgoing, complementary, and incoming strands are shown in orange, red and cyan, respectively. The effect of pulling the 3′5′ ends of the complementary strand and 3′5′ ends of the outgoing strand is represented. (B) Elongation rate histograms for strand exchange in 1 mM CaCl2 and 2 mM ATP while pulling the 3′5′ ends of the outgoing strand (blue), 3′5′ ends of the complementary strand (red) and controls in the presence of ssDNA fragments only (black); the black arrows correspond to molecules that were followed but showed no change in extension and the blue and red arrows indicate characteristic rates of 0.21 and 0.12 nm/s for pulling the outgoing and complementary strands, respectively.