Figure 1.

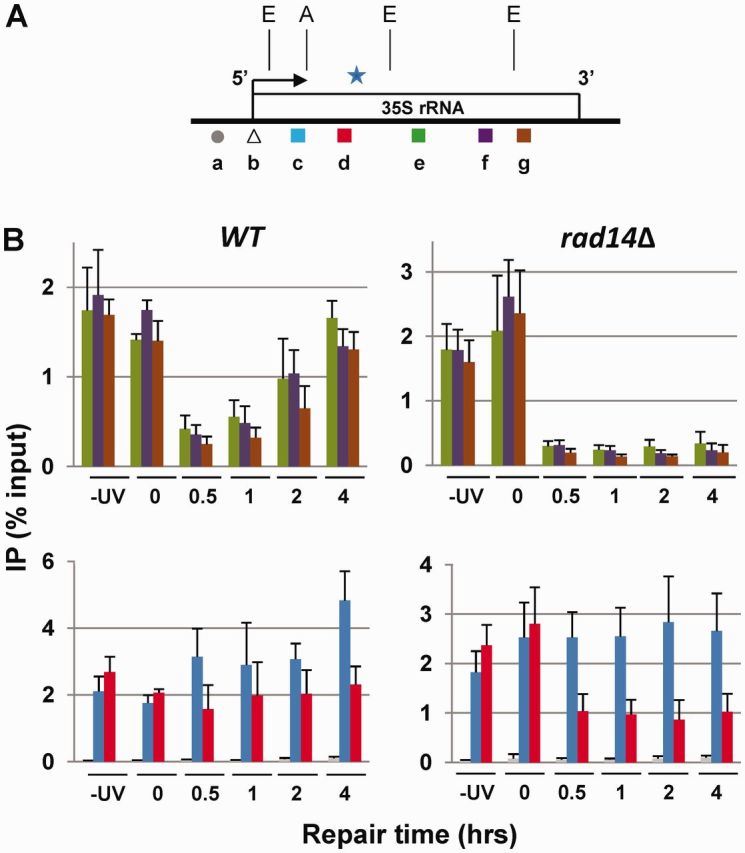
Dissociation of RNAPI from UV damaged TS. (A) Map of 35S rRNA gene; 5′-, 3′-end and direction of transcription (arrow) are shown. Amplicons ‘a’ to ‘g’ (average length ∼150 bp) synthesized in real-time polymerase chain reaction (qPCR); ‘b’ is used for the experiment described in Figure 2B. Star indicates the approximate ∼2.96 kb region downstream of transcription start site (additional information is presented in Supplementary Figure S1). (B) ChIP. Upper panel; data for amplicons ‘e’, ‘f’ and ‘g’. Lower panel; data for amplicons ‘a’ (control), ‘c’ and ‘d’. Means (±1 SD) of four independent biological experiments represent percent of input of total cellular extract.
