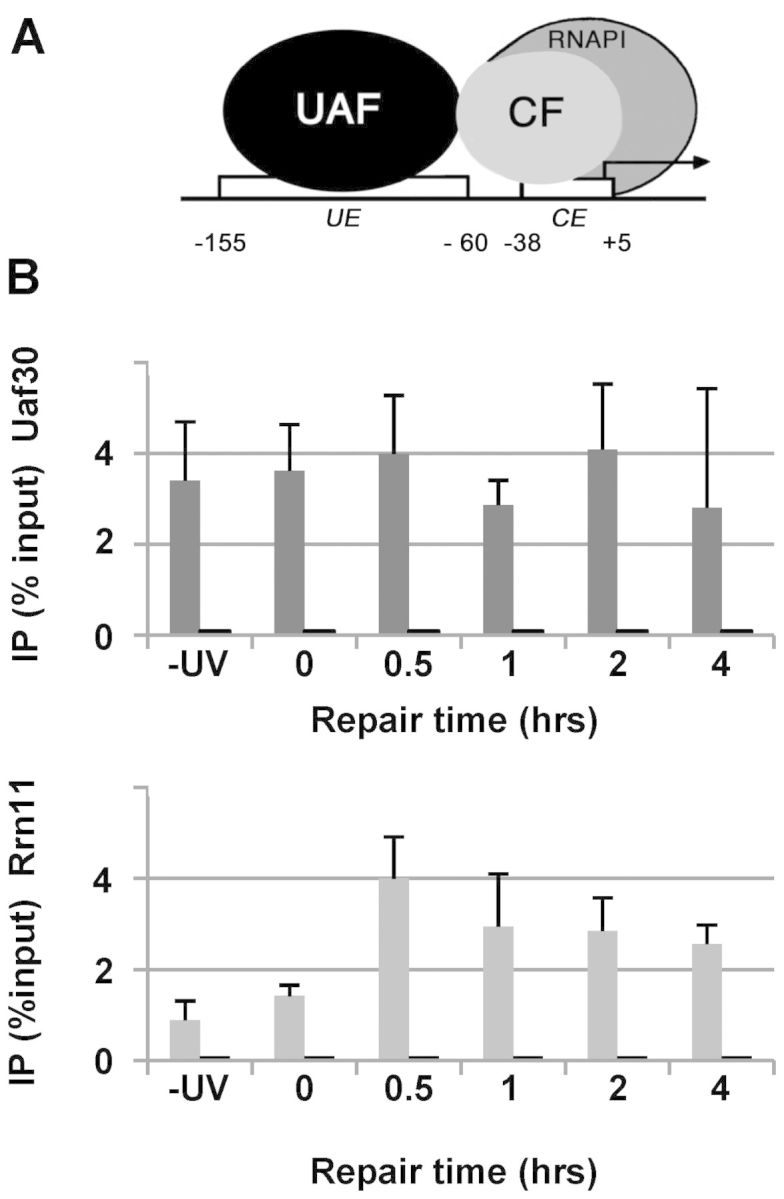
Figure 2.

(A) rDNA promoter; UE, CE, UAF and CF. (B) ChIP; amplicon ‘b’ (Figure 1A) is a qPCR 113 bp fragment (gray bars), amplicon ‘e’ (Figure 1A) was used as control (short black bars). Means (±1 SD) of four independent biological experiments represent the percent of input of total cellular extract.
