
Figure 3.

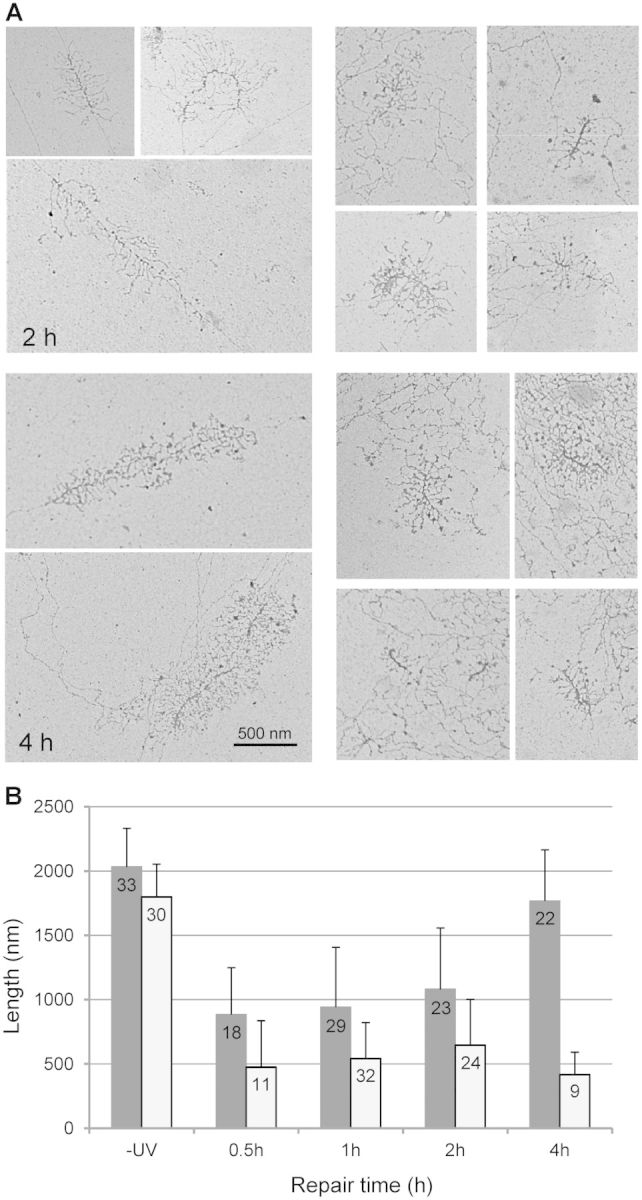
Electron micrographs of rRNA genes taken at different times after irradiation. (A) Chromatin spreads of log phase cells before irradiation (−UV) and at different times during repair (0.5–4 h), for wild-type (WT RAD14) and rad14Δ cells. (B): After visualization of rDNA transcription units from WT and rad14Δ, lengths were measured with ImageJ software (http://rsbweb.nih.gov/ij/) and compared to internal scale bars (100 and 500 nm). Data were from different preparations of chromatin spreads. The numbers of transcription units analyzed are described in the histogram and are shown in Supplementary Figure S3. Average lengths are in nm (SE: standard errors). WT; gray columns and rad14Δ; white columns.