
Figure 1.
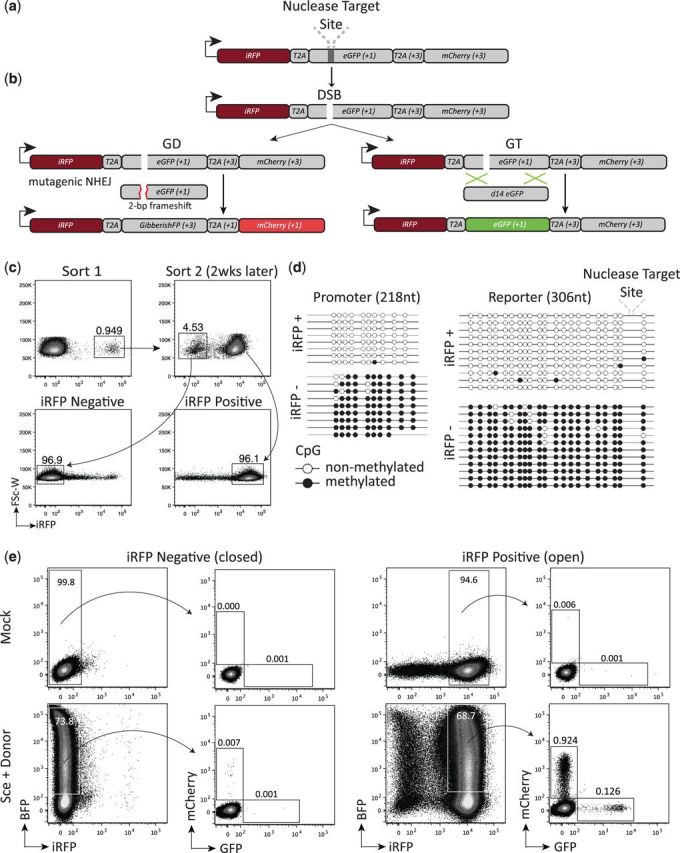
The AR-TLR. (a) Diagram of the AR-TLR. Arrow represents promoter and initial iRFP start codon. Reading frames relative to the initial iRFP start codon are indicated in parentheses. (b) Schematic showing the different genome engineering outcomes following the introduction of a DSB. If the break undergoes homologous GT the eGFP sequence is restored and the cell will fluoresce green. If the break undergoes gene disruption (GD/mutagenic NHEJ) resulting in a frameshift to the +3 reading frame, eGFP will be translated out of frame and the T2A and mCherry sequences will be translated in frame causing the cells to fluoresce red. (c) Representative flow plots depicting the flow cytometric-based method for deriving iRFP+/− populations of AR-TLR. (d) Depiction of bisulfite sequencing results generated from the two PCR amplicons of genomic DNA. Each circle corresponds to a CpG motif with a blank circle denoting nonmethylated CpG and black circle denoting methylated CpG. Sequences collected from the promoter region are shown on the left and those collected from the downstream reporter are shown on the right. (e) Flow cytometric analysis of HEK293T AR-TLR cells 72 h after transfection with the indicated pExodus constructs. Numbers shown inside plots indicate percentage of live cells. BFP expression is a marker for transfection efficiency.