
Figure 2.
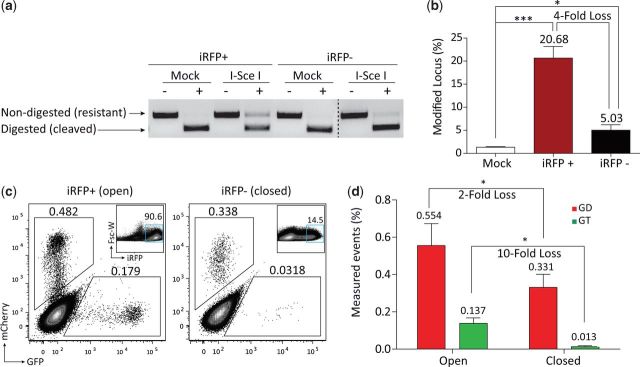
Assessing DNA repair pathway choice at open and closed loci. (a) Agarose gel showing results from digest of genomic DNA-generated amplicons with recombinant I-Sce I (denoted ‘+’ for containing recombinant I-Sce I and ‘−’ for no recombinant I-Sce I negative control). Nondigested (resistant) product is 776 bp and digested (cleaved) product is 388 bp. (b) Bar graph showing mean values for the amount of resistant (mutagenized) band observed over three replicates and fold loss in mutagenic product between iRFP+/− populations. *P < 0.05, ***P < 0.0005. P-values are shown in reference to mock. SEM is shown. (c) Flow cytometric analysis of HEK293T 5-aza-dC reactivated AR-TLR cells 2 weeks posttransfection with Sce + Donor pExodus expression constructs. Numbers shown adjacent to gates indicate percentage. Inset plots show locus reactivation and gating on iRFP+ cells that were used for analysis. (d) Bar graph quantifying results from panel ‘c’. Values represent the mean from three independent experiments performed in duplicate with indicated P-values and fold loss.