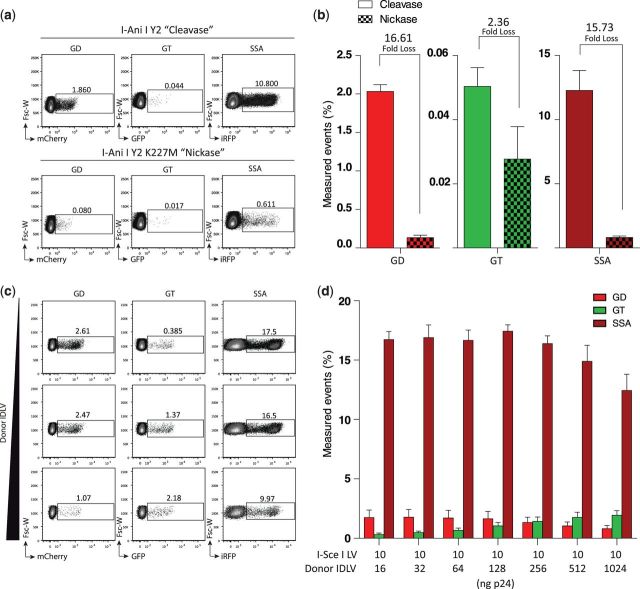
Figure 4.
Influence of DNA nicks and donor availability on repair pathway bias. (a) Flow cytometric analysis of HEK293T SSA-TLR with I-Ani I target site 72 h after transfection with indicated nuclease + donor constructs. (b) Graph representing mean values from panel ‘a’ with fold loss (FL) between cleavase and nickase shown. (c) Flow cytometric analysis of HEK293T SSA-TLR cells with I-Sce I target site 72 h after transduction with indicated amounts of I-Sce I (LV) and donor template (IDLV). p24 values indicate the amount of lentiviral capsid proteins added to the cells. (d) Quantification of data from panel ‘c’. Bars represent three individually performed experiments with SEM shown.

