
Figure 5.
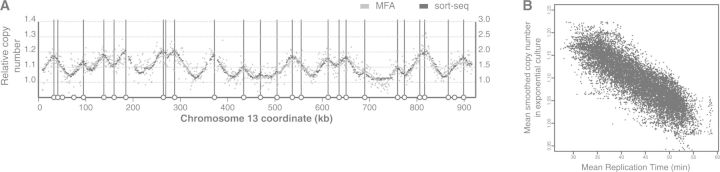
Direct measurement of genome replication in exponentially growing cells. (A) MFA as a proxy for replication time. Gray dots are the raw data points (in 1 kb windows), and the line shows the smoothed profile (left y-axis scale). Black dots show relative copy number from the (Illumina) sort-seq experiment (right y-axis scale). Open circles and vertical bars represent known replication origin locations. The full genome is shown in Supplementary Figure S10. (B) Comparison of MFA and median replication time (Trep).