
Figure 2.
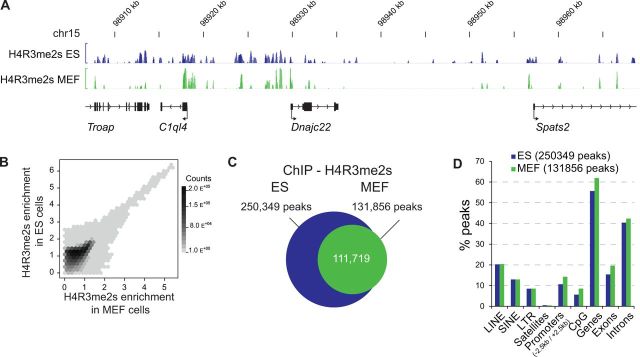
Genome-wide analyses of H4R3me2s in mouse ES cells and MEFs. (A) Representative ChIP-Seq data along a 65-kb window on mouse chromosome 15; normalized tag densities for H4R3me2s in ES and MEF are represented. Gene positions are indicated below. (B) Genome-wide correlation between H4R3me2s-enriched regions in ES (y-axis) and MEF (x-axis) cells. The scales of the x- and y-axis are transformed by the following formula: Log10(1 + x). Genomic regions (100-bp windows) with defined degrees of ES and MEF H4R3me2s enrichments are plotted as hexagonal tiles. The number of genomic regions in each hexagon is depicted by a grey colour scale of increasing darkness, according to the count scale reported on the right. (C) Venn diagram representing the number of MACS-predicted peaks (P < 1e-5) of H4R3me2s in ES and MEF cells. The intersection of the areas representing ES and MEF cells indicates peaks common to both cell types. (D) Comparisons of the localizations of ES and MEF’s H4R3me2s enrichments peaks. In both cell types, most peaks are located at genes.