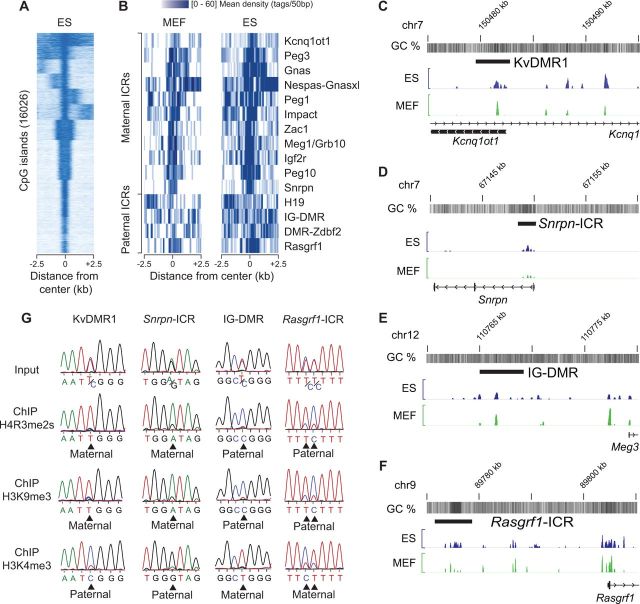
Figure 4.
Allelic H4R3me2s enrichment at ICRs. (A) The unsupervised clustering of non-oriented CpG islands (n = 16 026) is represented as a heatmap of H4R3me2s enrichment levels in mouse ES cells in a window of 5 kb around the centre of each CGIs (the minimum to maximum lengths of CGIs are 201–5129 bp with an average length of 655 bp). (B) Heatmap representation of H4R3me2s enrichments in MEF and ES cells at ICRs, which are DNA-methylated on the maternal (‘maternal ICRs’) or the paternal (‘paternal ICRs’) chromosome. (C–F) ChIP-seq profiles for H4R3me2s, in ES cells and MEFs at the KvDMR1 (C), Snrpn (D), IG-DMR (E) and Rasgrf1 (F) ICRs. (G) Sequence profiles around single nucleotide polymorphisms (SNPs) at the indicated ICRs. The parental alleles are equally present in the input chromatin used for ChIP (Input). H4R3me2s, H3K9me3 and H3K4me3 are preferentially enriched at one parental allele indicated by an arrow and the identified parental allele at ICRs. H3K4me3 is present on non-methylated alleles, while H4R3me2s and H3K9me3 are present on DNA-methylated alleles of ICRs.

